In a Public Health Service study, a histogram was plotted showing the number of cigarettes per day
Question:
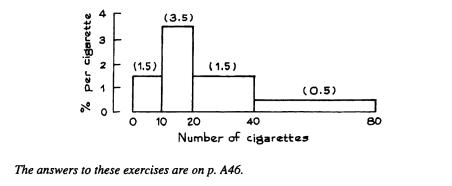
In a Public Health Service study, a histogram was plotted showing the number of cigarettes per day smoked by each subject (male current smokers), as shown below. The density is marked in parentheses. The class intervals include the right endpoint, not the left.
(a) The percentage who smoked 10 cigarettes or less per day is around 1.5% 15% 30% 50%
(b) The percentage who smoked more than a pack a day, but not more than 2 packs, is around 1.5% 15% 30% 50%
(There are 20 cigarettes in a pack.)
(c) The percent who smoked more than a pack a day is around 1.5% 15% 30% 50%
(d) The percent who smoked more than 3 packs a day is around 0.25 of 1% 0.5 of 1% 10%
(e) The percent who smoked 15 cigarettes per day is around 0.35 of 1% 0.5 of 1% 1.5% 3.5% 10% P-968

Step by Step Answer:


