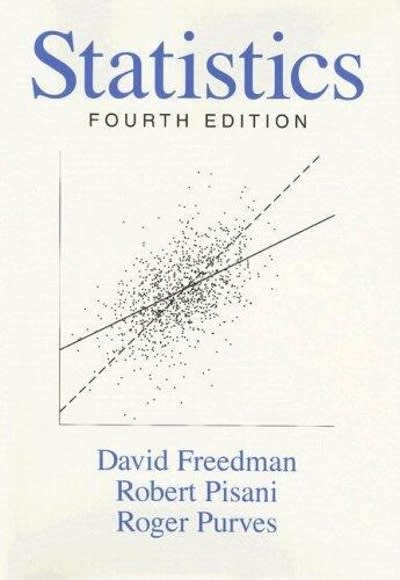
In this part of the book, scatter diagrams are used to graph the associ- ation between two
Question:
In this part of the book, scatter diagrams are used to graph the associ-
ation between two variables. If the scatter diagram is football-shaped, it can be summarized by the average and SD of the two variables, with *r* to measure the strength of the association. pl875
Step by Step Answer:
Related Book For 

Question Posted:


