Exercise 3.27 on page 176 compares studies which measure the proportions of adult and teen cell phone
Question:

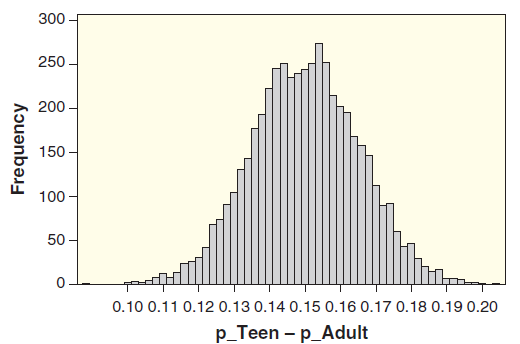
Figure 3.21 shows a distribution for the differences in sample proportions (pÌ‚t ˆ’ pÌ‚a) for 5000 bootstrap samples (taking 800 values with replacement from the original teen sample and 2252 from the adults).
Figure 3.21

(a) Based on the bootstrap distribution, which is the most reasonable estimate of the standard error for the difference in proportions: SE = 0.015, 0.030, 0.050, 0.10, or 0.15? Explain the reason for your choice.
(b) Using your choice for the SE estimate in part (a), find and interpret a 95% confidence interval for the difference in proportion of teen and adult cell phone users who send/receive text messages.
Exercise 3.27
A study of n = 2252 adults age 18 or older found that 72% of the cell phone users send and receive text messages. A study of n = 800 teens age 12 to 17 found that 87% of the teen cell phone users send and receive text messages. What is the best estimate for the difference in the proportion of cell phone users who use text messages, between adults (defined as 18 and over) and teens? Give notation (as a difference with a minus sign) for the quantity we are trying to estimate, notation for the quantity that gives the best estimate, and the value of the best estimate. Be sure to clearly define any parameters in the context of this situation.
DistributionThe word "distribution" has several meanings in the financial world, most of them pertaining to the payment of assets from a fund, account, or individual security to an investor or beneficiary. Retirement account distributions are among the most...
Step by Step Answer:

Statistics, Enhanced Unlocking The Power Of Data
ISBN: 9781119308843
2nd Edition
Authors: Robin H Lock, Patti Frazer Lock, Kari Lock Morgan, Eric F Lock, Dennis F Lock


