

Figure 4.15 shows a randomization distribution for testing H 0 : p = 0.3 vs H a
Question:
Figure 4.15
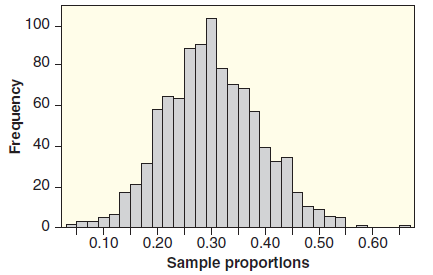 (a) The p-value for p̂ = 0.25 is closest to: 0.001 or 0.30?
(b) The p-value for p̂ = 0.15 is closest to: 0.04 or 0.40?
(c) The p-value for p̂ = 0.35 is closest to: 0.30 or 0.70?
A randomization distribution based on 1000 simulated samples is given along with the relevant null and alternative hypotheses. Which p-value most closely matches the observed statistic?
DistributionThe word "distribution" has several meanings in the financial world, most of them pertaining to the payment of assets from a fund, account, or individual security to an investor or beneficiary. Retirement account distributions are among the most...
Fantastic news! We've Found the answer you've been seeking!
Step by Step Answer:
This is a lefttail test so in each case we are estimating ...View the full answer

Answered By
Muhammad Umair
I have done job as Embedded System Engineer for just four months but after it i have decided to open my own lab and to work on projects that i can launch my own product in market. I work on different softwares like Proteus, Mikroc to program Embedded Systems. My basic work is on Embedded Systems. I have skills in Autocad, Proteus, C++, C programming and i love to share these skills to other to enhance my knowledge too.
1+ Reviews
10+ Question Solved
Related Book For 

Statistics, Enhanced Unlocking The Power Of Data
ISBN: 9781119308843
2nd Edition
Authors: Robin H Lock, Patti Frazer Lock, Kari Lock Morgan, Eric F Lock, Dennis F Lock
Question Posted:
