

Question: In Exercise 2.109 on page 89, we discuss a study in which the Nielsen Company measured connection speeds on home computers in nine different countries
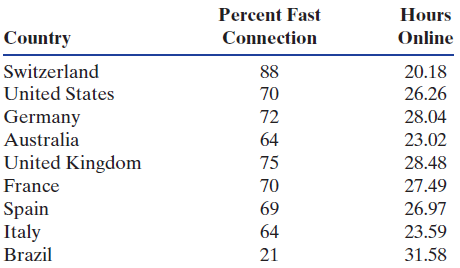
In Exercise 2.109 on page 89, we discuss a study in which the Nielsen Company measured connection speeds on home computers in nine different countries in order to determine whether connection speed affects the amount of time consumers spend online. Table 2.33 shows the percent of Internet users with a €˜€˜fast€ connection (defined as 2 Mb or faster) and the average amount of time spent online, defined as total hours connected to the web from a home computer during the month of February 2011. The data are also available in the dataset GlobalInternet.
Table 2.33
(a) What would a positive association mean between these two variables? Explain why a positive relationship might make sense in this context.
(b) What would a negative association mean between these two variables? Explain why a negative relationship might make sense in this context.
(c) Make a scatterplot of the data, using connection speed as the explanatory variable and time online as the response variable. Is there a positive or negative relationship? Are there any outliers? If so, indicate the country associated with each outlier and describe the characteristics that make it an outlier for the scatterplot.
(d) If we eliminate any outliers from the scatterplot, does it appear that the remaining countries have a positive or negative relationship between these two variables?
(e) Use technology to compute the correlation. Is the correlation affected by the outliers?
(f) Can we conclude that a faster connection speed causes people to spend more time online?
Exercise 2.109
The Nielsen Company measured connection speeds on home computers in nine different countries and wanted to determine whether connection speed affects the amount of time consumers spend online. Table 2.26 shows the percent of Internet users with a €˜€˜fast€ connection (defined as 2Mb or faster) and the average amount of time spent online, defined as total hours connected to the web from a home computer during the month of February 2011. The data are also available in the dataset GlobalInternet.
Table 2.26
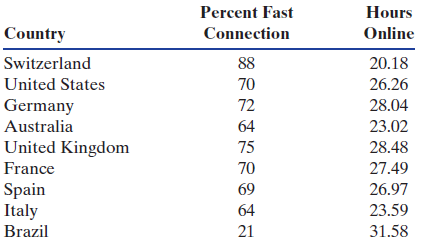
Percent Fast Hours Online Country Connection Switzerland 88 20.18 United States 70 26.26 Germany Australia 72 28.04 64 23.02 United Kingdom 75 28.48 France 70 27.49 Spain Italy Brazil 69 26.97 64 23.59 21 31.58 Percent Fast Hours Country Connection Online Switzerland 88 20.18 United States 70 26.26 Germany 72 28.04 Australia 64 23.02 United Kingdom 75 28.48 France 70 27.49 Spain Italy 69 26.97 64 23.59 Brazil 21 31.58
Step by Step Solution
3.38 Rating (160 Votes )
There are 3 Steps involved in it
a A positive relationship implies that as connection speed goes up time online goes up This might ma... View full answer

Get step-by-step solutions from verified subject matter experts