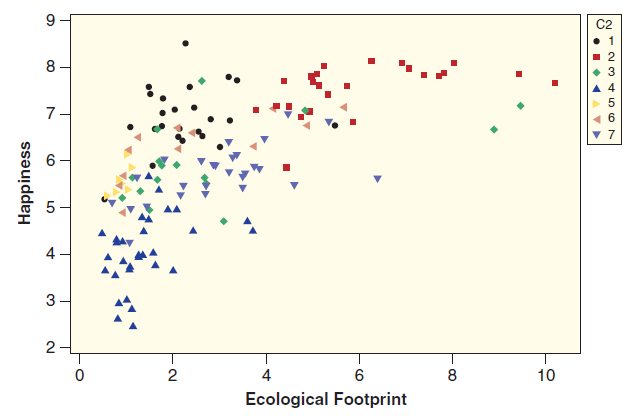
In Exercise 2.172 on page 114, we introduce the dataset HappyPlanetIndex, which includes information for 143 countries
Question:
(a) Using technology and the data in HappyPlanetIndex, create a scatterplot to use LifeExpectancy to predict Happiness. Is there enough of a linear trend so that it is reasonable to construct a regression line?
(b) Find a formula for the regression line and display the line on the scatterplot.
(c) Interpret the slope of the regression line in context.
Exercise 2.172
The website TED.com offers free short presentations, called TED Talks, on a variety of interesting subjects. One of the talks is called €˜€˜The Happy Planet Index,€ by Nic Marks. Marks comments that we regularly measure and report economic data on countries, such as Gross National Product, when we really ought to be measuring the well-being of the people in the countries. He calls this measure Happiness, with larger numbers indicating greater happiness, health, and well-being. In addition, he believes we ought to be measuring the ecological footprint, per capita, of the country, with larger numbers indicating greater use of resources (such as gas and electricity) and more damage to the planet. Figure 2.57 shows a scatterplot of these two quantitative variables. The data are given in HappyPlanetIndex.
Figure 2.57

Step by Step Answer:

Statistics Unlocking The Power Of Data
ISBN: 9780470601877
1st Edition
Authors: Robin H. Lock, Patti Frazer Lock, Kari Lock Morgan, Eric F. Lock, Dennis F. Lock


