

4. (***) (Microsoft Excel problem) The chart at the bottom of the page shows an Excel spreadsheet...
Question:
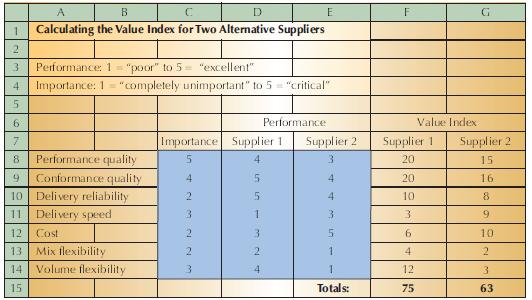
4. (***) (Microsoft Excel problem) The chart at the bottom of the page shows an Excel spreadsheet that calculates the value index for two alternative suppliers. Re-create this spreadsheet in Excel. You should develop the spreadsheet so that the results will be recalculated if any of the values in the highlighted cells are changed.Your formatting does not have to be exactly the same, but the numbers should be.
(As a test, see what happens if you change all of the importance scores to 3.Your new value indices for Supplier 1 and Supplier 2 should be 72 and 63, respectively.)
Fantastic news! We've Found the answer you've been seeking!
Step by Step Answer:

Answered By
Bhartendu Goyal
Professional, Experienced, and Expert tutor who will provide speedy and to-the-point solutions. I have been teaching students for 5 years now in different subjects and it's truly been one of the most rewarding experiences of my life. I have also done one-to-one tutoring with 100+ students and help them achieve great subject knowledge. I have expertise in computer subjects like C++, C, Java, and Python programming and other computer Science related fields. Many of my student's parents message me that your lessons improved their children's grades and this is the best only thing you want as a tea...
2+ Reviews
10+ Question Solved
Related Book For 

Introduction To Operations And Supply Chain Management
ISBN: 9780131791039
2nd Edition
Authors: Cecil C. Bozarth, Robert B. Handfield
Question Posted:
