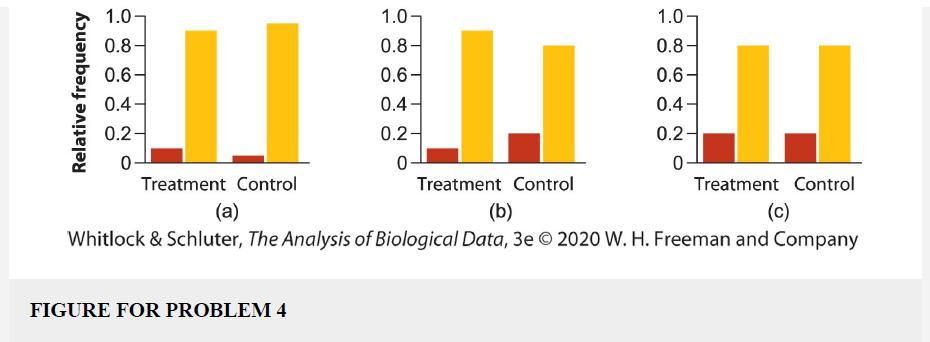
The hypothetical plots below show the relative frequencies of subjects assigned to two experimental groups (treatment and
Question:
The hypothetical plots below show the relative frequencies of subjects assigned to two experimental groups (treatment and control). The frequency of negative outcomes (red) and positive outcomes (gold) is illustrated. For each plot (a), (b), and (c), identify the correct value of relative risk from the following list of choices: 0.1, 0.5, 1, 2, or 9.

Fantastic news! We've Found the answer you've been seeking!
Step by Step Answer:
Related Book For 

The Analysis Of Biological Data
ISBN: 9781319226237
3rd Edition
Authors: Michael C. Whitlock, Dolph Schluter
Question Posted:


