

Question: In Fig. 40.28, how does the probability of finding a particle in the center half of the region -A < x < A compare to
In Fig. 40.28, how does the probability of finding a particle in the center half of the region -A
Fig.40.28
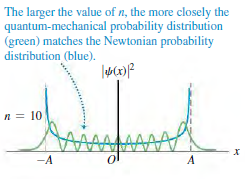
The larger the value of n, the more closely the quantum-mechanical probability distribution (green) matches the Newtonian probability distribution (blue). n = 10 -A A
Step by Step Solution
★★★★★
3.53 Rating (167 Votes )
There are 3 Steps involved in it
1 Expert Approved Answer
Step: 1 Unlock

The wave function is smaller in the region A2 x A2 ... View full answer
Question Has Been Solved by an Expert!
Get step-by-step solutions from verified subject matter experts
Step: 2 Unlock
Step: 3 Unlock