

Question: You set up the circuit shown in Fig. 26.22a, where R = 196 Ω. You close the switch at time t = 0 and measure
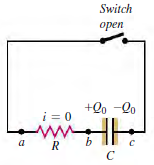
You set up the circuit shown in Fig. 26.22a, where R = 196 Ω. You close the switch at time t = 0 and measure the magnitude i of the current in the resistor R as a function of time t since the switch was closed. Your results are shown in Fig. P26.80, where you have chosen to plot ln i as a function of t.
(a) Explain why your data points lie close to a straight line.
(b) Use the graph in Fig. P26.80 to calculate the capacitance C and the initial charge Q0 on the capacitor.
(c) When i = 0.0500 A, what is the charge on the capacitor?
(d) When q = 0.500 × 10⁻⁴ C, what is the current in the resistor?
Figure P26.80
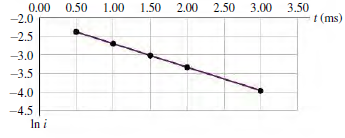
Figure 26.22a
0.00 0.50 -2.0 1.00 1.50 2.00 2.50 3.00 3.50 t (ms) -2.5 -3.0 -3.5 -4.0 -4.5 In i Switch open +2o -2o +Qo a R b.
Step by Step Solution
3.47 Rating (163 Votes )
There are 3 Steps involved in it
IDENTIFY and SET UP When the switch S is closed current begins to flow as the capacitor plates disch... View full answer

Get step-by-step solutions from verified subject matter experts