

Question: The capacitor in figure a is 51nF with a tolerance of 10%. Given the voltage waveform in figure b, graph the voltage i(t) for the
The capacitor in figure a is 51nF with a tolerance of 10%. Given the voltage waveform in figure b, graph the voltage i(t) for the minimum and maximum inductor values.
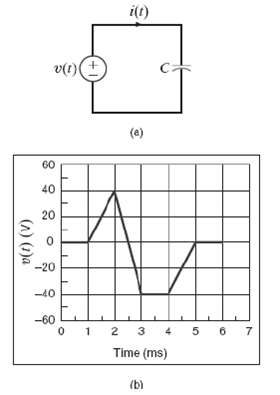
i(t) v(t)(+ (e) 60 40 20 -20 -40 -60 0 1 2 3 4 Time (ms) (b) (A) (1)a
Step by Step Solution
★★★★★
3.36 Rating (168 Votes )
There are 3 Steps involved in it
1 Expert Approved Answer
Step: 1 Unlock

it dvt dt for oct lms it OA for lms t 2ms it 1 11 5mm 4x10Y ... View full answer
Question Has Been Solved by an Expert!
Get step-by-step solutions from verified subject matter experts
Step: 2 Unlock
Step: 3 Unlock
Document Format (1 attachment)
27-E-E-C-A (1406).docx
120 KBs Word File