

1. Consider the following set of data that relates daily electricity usage as a function of outside...
Question:
1. Consider the following set of data that relates daily electricity usage as a function of outside high temperature
(for the day):
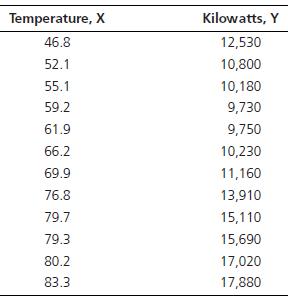
a. Plot the raw data. What pattern do you see? What do you think is really affecting electricity usage?
b. Solve this problem with linear regression Y = a + bX (in a spreadsheet). How well does this work? Plot your results. What is wrong? Calculate the sum-of-thesquares error and R2.
c. Solve this problem by using nonlinear regression. We recommend a quadratic function, Y = a + b1X + b2X2.
How well does this work? Plot your results. Is anything wrong? Calculate the sum-of-the-squares error and R2.
d. Break up the problem into three sections (look at the plot). Solve it using three linear regression models—
one for each section. How well does this work? Plot your results. Calculate the sum-of-the-squares error and R2. Is this modeling approach appropriate? Why or why not?
e. Build a neural network to solve the original problem.
(You may have to scale the X and Y values to be between 0 and 1.) Train it (on the entire set of data)
and solve the problem (i.e., make predictions for each of the original data items). How well does this work?
Plot your results. Calculate the sum-of-the-squares error and R2.
f. Which method works best and why?
Step by Step Answer:

This question has not been answered yet.
You can Ask your question!

Decision Support And Business Intelligence Systems
ISBN: 9780136107293
9th Edition
Authors: Dursun Delen Efraim Turban, Ramesh Sharda
