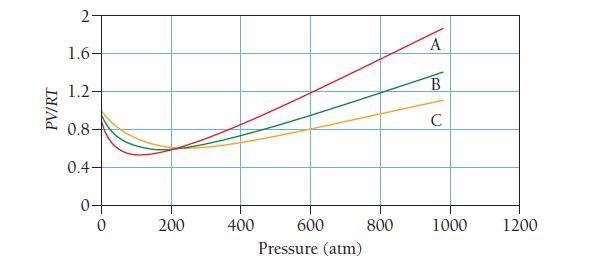
The graph shows PV/RT for carbon dioxide at three different temperatures. Rank the curves in order of
Question:
The graph shows PV/RT for carbon dioxide at three different temperatures. Rank the curves in order of increasing temperature.
(a) C
(b) A
(c) B
(d) C
Transcribed Image Text:
PV/RT 2. 1.6- 1.2- 0.8- 0.4- 0- 0 200 400 600 Pressure (atm) 800 A B C 1000 1200
Fantastic news! We've Found the answer you've been seeking!
Step by Step Answer:
Answer rating: 50% (4 reviews)
b A B C Curve A is the lowest temperature curve because it deviates the most from ideal...View the full answer

Answered By

Stephen ouma
I have worked with different academic writing companies such as wriredom, writerbay, and Upwork. While working with these companies, I have helped thousands of students achieve their academic dreams. This is what I also intend to do here in SolutionInn
4.90+
19+ Reviews
63+ Question Solved
Related Book For 

Question Posted:
Students also viewed these Sciences questions
-
In Exercises 60-64, use the diagram at the right. Name a pair of opposite rays. P Q A E C B D
-
The following information refers to the non-current assets on Dubley Ltd for the year ended 31 December 2022. Land (purchased on 01 January 2022) $1,600,000 Office building thereon (purchased on 01...
-
In Exercises 60-64, use the diagram at the right. Name all rays with endpoint B. P 0 A E C ''B D
-
(1) How Does Strategy Respond to Environmental Factors Imprima Corporation is based in the United States and is examining the prospects for expanding into international markets with its main product,...
-
What is the relationship between XBRL and IDEA?
-
Deirdre McCloskey, an economist at the University of Illinois at Chicago, argued, A poor country that adopts thoroughgoing innovation . . . can get within hailing distance of the West . . . in about...
-
Compose a letter to a potential lender addressing only the issue of why the or ganizational structure you have selected for your new business group makes it advantageous for the lender to grant you...
-
1. Cisco Systems went from a push to a pull approach to its supply chain after the dot-com debacle. How are these two approaches different? Does it depend on the state of the economy, which one...
-
(Related to Checkpoint 9.2 and Checkpoint 9.3) (Bond valuation relationships) The 17-year, $1,000 par value bonds of Waco Industries pay 6 percent interest annually. The market price of the bond is...
-
On January, 2020, P Company acquired 90% of S Company in exchange for 5,400 shares of P10 par common stock having a market value of P120,600. P and S condensed balance sheet where as follows: P...
-
A 12.5-L scuba diving tank contains a heliumoxygen (heliox) mixture made up of 24.2 g of He and 4.32 g of O 2 at 298 K. Calculate the mole fraction and partial pressure of each component in the...
-
Why is it impossible to breathe air through an extra-long snorkel (longer than a couple of meters) while swimming under water?
-
Consider the accompanying data on x = research and development expenditure (thousands of dollars) and y = growth rate (% per year) for eight different industries. a. Would a simple linear regression...
-
What is a transistor, and what are its types?
-
Discuss the emerging role of nanotechnology in electrical engineering, focusing on its applications in enhancing electrical components like batteries, supercapacitors, and sensors.Explore the...
-
1. As resistors are added in parallel to an existing circuit, what happens to the voltage drop measured across each resistor? 2. In the circuit shown on the right, which path (left or right) will...
-
Make a copy of the isothermal transformation diagram for a 0.45 wt% C iron-carbon alloy (Figure 10.39), and then sketch and label on this diagram the time-temperature paths to produce the following...
-
Walker, Inc., is an all-equity firm. The cost of the company's equity is currently 11.4 percent and the risk-free.rate is 3.3 percent. The company is currently considering a project that will cost...
-
Determine the moment at B, then draw the moment diagram for each member of the frame. Assume the supports at A and C are pins. EI is constant. 8 kN/m B. 6 m
-
Determine the moment at B, then draw the moment diagram for the beam. Assume the support at A is pinned, B is a roller and C is fixed. EI is constant. 4 k/ft B. PA - 12 ft- 15 ft
-
Determine the moments at A, B, and C by the moment-distribution method. Assume the supports at A and C are fixed and a roller support at B is on a rigid base. The girder has a thickness of 4 ft. Use...
-
CROSS RATES The table below gives the exchange rates between U.S. dollar, British pound and Swedish krona. What is the exchange rate between Swedish kronas and pounds? Round your answer to two...
-
Presented below is pension information related to Blossom Company as of December 31, 2021: Accumulated benefit obligation Projected benefit obligation Plan assets (at fair value) Accumulated OCI...
-
Accountants should leverage technology such as artificial intelligence and robotic process automation (RPA) to A) Decrease the time spent on mundane tasks and increase the time spent on strategy...

Study smarter with the SolutionInn App


