2.11 A shirt inspector at a clothing factory categorized the last 500 defects as follows: 67missing button,
Question:
2.11 A shirt inspector at a clothing factory categorized the last 500 defects as follows: 67—missing button, 153—bad seam, 258—improperly sized, 22—fabric flaw. Construct a Pareto diagram for this information.

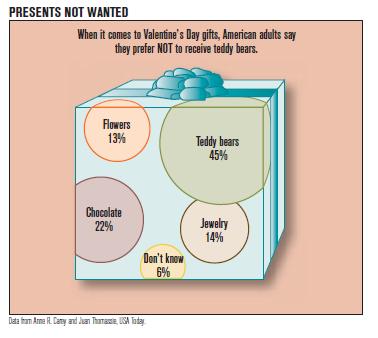
a. Draw a bar graph picturing the percentages of “Presents not wanted.”
b. Draw a Pareto diagram picturing the “Presents not wanted.”
c. If you want to be 80% sure you did not get your Valentine something unwanted, what should you avoid buying? How does the Pareto diagram show this?
d. If 300 adults are to be surveyed, what frequencies would you expect to occur for each unwanted item listed on the graphic?
Step by Step Answer:
Related Book For 

Just The Essentials Of Elementary Statistics
ISBN: 9780495314875
10th Edition
Authors: Robert Johnson, Patricia Kuby
Question Posted:


