

Refer to the scatter diagram that follows. b. Find the sample size. c. What is the smallest
Question:
Refer to the scatter diagram that follows.
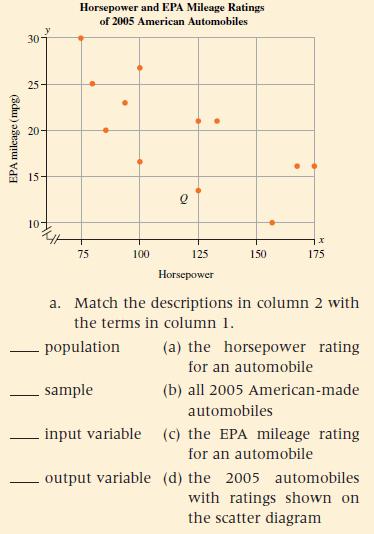
b. Find the sample size.
c. What is the smallest value reported for the output variable?
d. What is the largest value reported for the input variable?
e. Does the scatter diagram suggest a positive, negative, or zero linear correlation coefficient?
f. What are the coordinates of point Q?
g. Will the slope for the line of best fit be positive, negative, or zero?
h. Will the intercept for the line of best fit be positive, negative, or zero?
Fantastic news! We've Found the answer you've been seeking!
Step by Step Answer:

Answered By
Ajeet Singh
Professional, Experienced, and Expert tutor who will provide speedy and to-the-point solutions.
I have been teaching students for 5 years now in different subjects and it's truly been one of the most rewarding experiences of my life.
I have also done one-to-one tutoring with 100+ students and help them achieve great subject knowledge.
I have expertise in computer subjects like C++, C, Java, and Python programming and other computer Science related fields.
Many of my student's parents message me that your lessons improved their children's grades and this is the best only thing you want as a teacher. I have done plenty of studying and lots of learning on many exciting and challenging topics. All these experiences have influenced my decision to take on the teaching role in various capacities. As a tutor, I am looking forward to getting to understand your needs and helping you achieve your academic goals. I'm highly flexible and contactable. I am available to work on short notice since I only prefer to work with very small and select groups of students.
7+ Reviews
15+ Question Solved
Related Book For 

Just The Essentials Of Elementary Statistics
ISBN: 9780495314875
10th Edition
Authors: Robert Johnson, Patricia Kuby
Question Posted:
