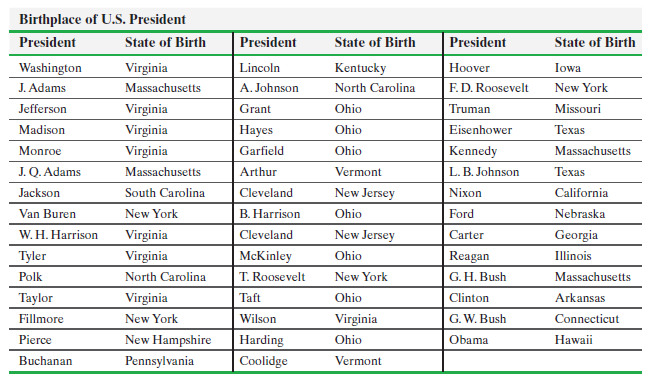
The following table lists the presidents of the United States (as of May, 2016) and their state
Question:

(a) Construct a frequency bar graph for state of birth.
(b) Which state has yielded the most presidents?
(c) Explain why the answer obtained in part (b) may be misleading.
Transcribed Image Text:
Birthplace of U.S. President President State of Birth President State of Birth President State of Birth Washington Virginia Lincoln Kentucky Нoover Iowa J. Adams F. D. Roosevelt Massachusetts A. Johnson North Carolina New York Virginia Jefferson Grant Ohio Truman Missouri Eisenhower Madison Virginia Нayes Ohio Texas Kennedy Monroe Virginia Garfield Ohio Massachusetts J. Q. Adams Massachusetts Arthur Vermont L. B. Johnson Texas Jackson New Jersey Nixon South Carolina Cleveland California B. Harrison Van Buren New York Ohio Ford Nebraska W. H. Harrison Cleveland New Jersey Virginia Carter Georgia Tyler Virginia McKinley Ohio Reagan Illinois Polk G. H. Bush North Carolina T. Roosevelt New York Massachusetts Taylor Virginia Taft Ohio Clinton Arkansas G. W. Bush Fillmore New York Wilson Virginia Connecticut New Hampshire Pierce Harding Ohio Obama Hawaii Buchanan Pennsylvania Coolidge Vermont
Fantastic news! We've Found the answer you've been seeking!
Step by Step Answer:
Answer rating: 71% (14 reviews)
a The US Presidents Birthplaces b More presidents were ...View the full answer

Answered By

Rajeev Malhotra
I am postgraduate in Physics. I have done my post graduation from Agra University ( new name is Dr. B. R. Ambedkar University) in 1987.Teaching is my passion. I love to help children in their studies. I have taught students Of CBSE board and ICSE board .I teach mathematics to the students grades 6- 10th. I have 10 years of teaching experience. I have also taught in a coaching center for some time. My way of teaching is very simple. I try to understand the level of students and change my style as per their needs. I focus on basic concepts. I encourage students to ask questions so that I can help them to understand the topic very well.
0.00
0 Reviews
10+ Question Solved
Related Book For 

Question Posted:
Students also viewed these Mathematics questions
-
The following table lists the 44 presidents of the United States. (a) Obtain a simple random sample of size 8 using Table I in Appendix A, a graphing calculator, or computer software. (b) Obtain a...
-
The ages of the Vice Presidents of the United States at the time of their death are listed below. Use the data to construct a frequency distribution, histogram, frequency polygon, and ogive, using...
-
The following table lists the National Basketball Associations (NBAs) leading scorers, their average minutes per game (MPG), and their average points per game (PPG) for 2008: Construct and interpret...
-
In a survey of 1,002 people, 701 (or 70%) said that they voted in the last presidential election (based on data from ICR Research Group). The margin of error was 3 percentage points. However, actual...
-
For the two-dimensional fluid flow shown in Figure P14 -10, determine the potentials at the center and right edge. Figure P14-10 2 m p = 10 m q* - 25 x 10 m/s 2 m
-
The assignment will be to watch the Juana Bordas video about Diversity and Leadership for a Multicultural Age, and What is one takeaway from the Juana Bordas video that was the most interesting to...
-
The required return on an investment is 10 percent. You estimate that firm Xs dividends will grow as follows: Year Dividend 1 $1.20 2 2.00 3 3.00 4 4.50 For the subsequent years you expect the...
-
Each year, ratings are compiled concerning the performance of new cars during the first 90 days of use. Suppose that the cars have been categorized according to whether a car needs warranty-related...
-
The assets and abilities of Global Travel Agency on December 31, 2045, and its revenue and expenses for the year are as follows: Accounts payable Accounts receivable Cash Common stock Foes earned...
-
Match the following and select the correct option. Height of Binary search tree(in worst o([log ]-1) 1 a (2n+1) case) Height of Ternary tree b O(n) Height of B-tree(when c minimum degree, -2) (log,...
-
A frequency distribution lists the __________ of occurrences of each category of data, while a relative frequency distribution lists the __________ of occurrences of each category of data.
-
Acrolein is an α,β-unsaturated aldehyde that is used in the production of a variety of polymers. Acrolein can be prepared by treating glycerol with an acid catalyst. Propose...
-
How would the output of the Client1 program shown in this section change if each field from ArrayIntList were declared static ?
-
# III: Worksheet 3 1. A 20 kg mass is allowed to accelerate down a frictionless 15 ramp. 20 kg 15 a. Draw a force diagram for the block. b. Determine the value of the x-component of the force of...
-
3.Baker Corporation has provided the following production and average cost data for two levels of monthly production volume. The company produces a single product Production Volume: 1,000 units:...
-
Suppose that you own the only company in the market to produce a certain product, and therefore you can determine the market price P dollars for each unit. Due to government regulations, the price of...
-
describes how the blast pressure front can bounce off solid, immovable obstacles and be redirected in another direction in a linear angle to the angle of the obstacle hat was struck
-
As the accounting clerk, you are tasked by the CFO to determine the cost of goods sold of Del Mundo Company for the year ended December 31, 2020. During Operating cost data annd inventory account...
-
Solve each equation. |5x 1| = 21
-
Use a calculator to evaluate the expression. Round your result to the nearest thousandth. V (32 + #)
-
The following data represent the tuition for all 2-year public community colleges in California in 20092010. Tuition (dollars) ... Number of Community Colleges 775799 ....... 22 800824 ....... 68...
-
The following data represent the number of earthquakes worldwide in 2010 with magnitudes less than 9.0 (as of October 15, 2010). Magnitude .... Number 00.9 ....... 22 1.01.9 ....... 22 2.02.9 ..........
-
The following data represent the number of live births in the United States in 2007 for women 15 to 49 years old. Age .... Live Births 1519 .... 445,045 2024 .... 1,082,837 2529 .... 1,208,405 3034...
-
Ventaz Corp manufactures small windows for back yard sheds. Historically, its demand has ranged from 30 to 50 windows per day with an average of 4646. Alex is one of the production workers and he...
-
Which of the following statements is not true regarding the $500 credit for dependent other than a qualifying child credit. Cannot be claimed on the same tax return if the child tax credit is also...
-
Grind Co. is considering replacing an existing machine. The new machine is expected to reduce labor costs by $127,000 per year for 5 years. Depreciation on the new machine is $57,000 compared with...

Study smarter with the SolutionInn App


