Figure 17.15 shows a FrostEbsworth diagram for chlorine. (a) How is this diagram related to the potential
Question:
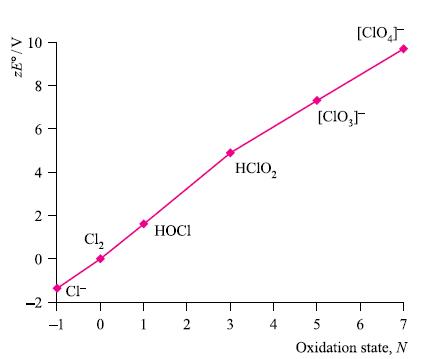
Figure 17.15 shows a Frost–Ebsworth diagram for chlorine.
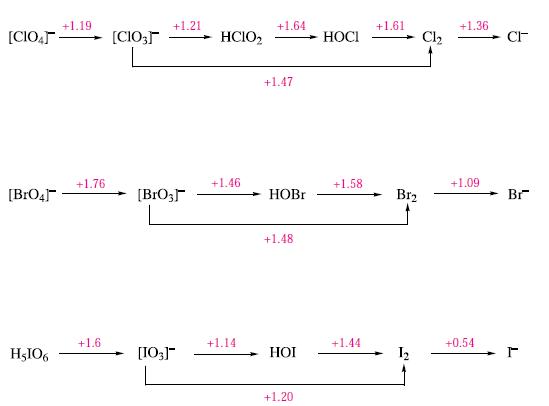
(a) How is this diagram related to the potential diagram for chlorine in Fig. 17.14?
(b) Which is the most thermodynamically favoured species in Fig. 17.15? Explain how you reach your conclusion.
(c) State, with reasons, which species in the figure is the best oxidizing agent.
(d) Why is it important to state the pH value in the caption to Fig. 17.15?
Figure 17.14.

Figure 17.15

Fantastic news! We've Found the answer you've been seeking!
Step by Step Answer:
Related Book For 

Question Posted:


