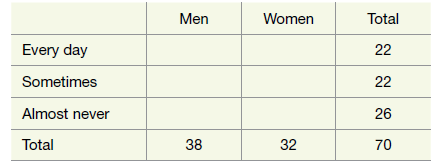
Reconsider the previous exercise about sex and coff ee consumption. The sample data could be organized in
Question:

a. Fill in the table with counts (which you make up) in such a way that there€™s almost no association between sex and coffee consumption. Also draw the appropriate graph to display what your made-up data reveal.
b. Now fill in the table with counts (which you make up) in such a way that there€™s a strong association between sex and coffee consumption. Again draw the appropriate graph to display what your made-up data reveal.
Fantastic news! We've Found the answer you've been seeking!
Step by Step Answer:
Related Book For 

Introduction To Statistical Investigations
ISBN: 9781118172148
1st Edition
Authors: Beth L.Chance, George W.Cobb, Allan J.Rossman Nathan Tintle, Todd Swanson Soma Roy
Question Posted:


