

The following data show the systolic blood pressures (SBP) of 12 men as well as their weights.
Question:
The following data show the systolic blood pressures (SBP) of 12 men as well as their weights. 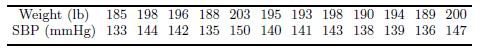 Obtain by least squares regression the linear relationship between the weights and the SBP and test for the parameters of the regression equation.
Use ANOVA to test whether the fitted model is significant. Obtain the estimated values of SBP and hence, using the residuals, check that the assumptions underlying linear regression are satisfied.
Fantastic news! We've Found the answer you've been seeking!
Step by Step Answer:

Answered By
Junaid ahmed
I am an English language professor with years of experience In Teaching English Language and Literature. I like to help people in the various difficult matter.
2+ Reviews
10+ Question Solved
Related Book For 
Financial Accounting The Cornerstone Of Business Decision Making
ISBN: 0357132696
5th Edition
Authors: Jay S Rich, Jeff Jones, Linda Ann Myers
Question Posted:
