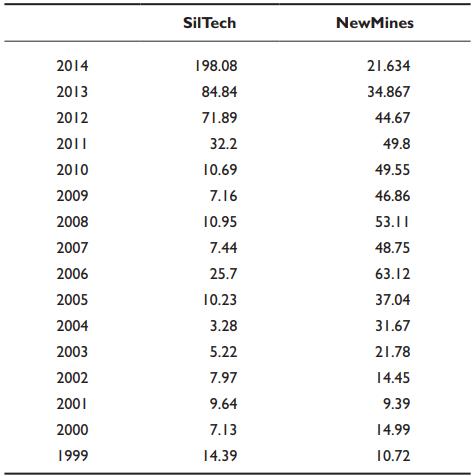
Closing prices for SilTech and New Mines for the years 19992014 are shown below. a. Calculate the
Question:
Closing prices for SilTech and New Mines for the years 1999–2014 are shown below.
a. Calculate the total returns for each stock for the years 2000–2014 to three decimal places. Note that the price for 1999 is used to calculate the return for 2000.
b. Assume that similar returns will continue in the future (i.e., average returns = expected returns). Calculate the expected return, variance, and standard deviation for both stocks and insert these values in the spreadsheet. Use Average, Var, and STDEV functions.
c. Calculate the covariance between these two stocks based on the 15 years of returns.
d. Using the 11 different proportions that SilTech could constitute of the portfolio ranging from 0 to 100 percent in 10 percent increments, calculate the portfolio variance, standard deviation, and expected return.
e. Plot the trade‐off between return and risk for these two stocks based on the calculation in (d). Use the XY scatter diagram in Excel.

Step by Step Answer:

Investments Analysis And Management
ISBN: 9781118975589
13th Edition
Authors: Charles P. Jones, Gerald R. Jensen


