

Question: Use the data in Table 9.2 to assign the Q branch lines in Figure 9.6. Account for the relative intensities. Figure 9.6 Table 9.2 Spectroscopic
Use the data in Table 9.2 to assign the Q branch lines in Figure 9.6. Account for the relative intensities.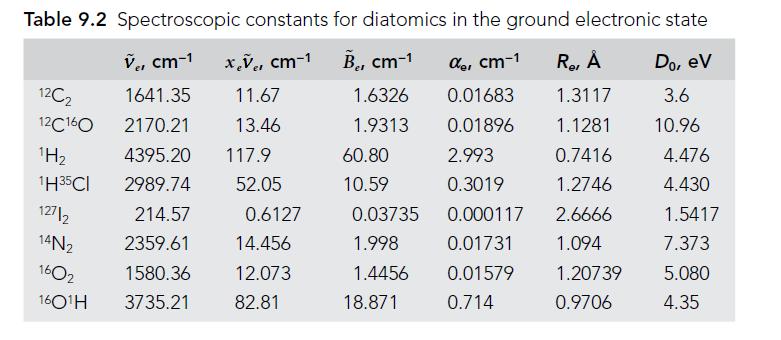
Figure 9.6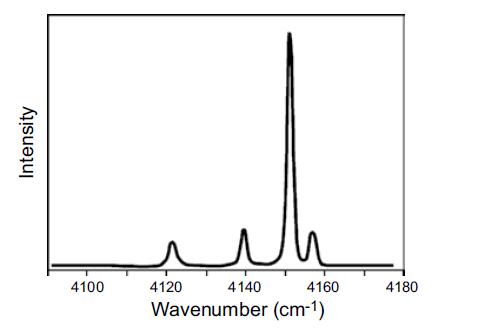
Table 9.2 Spectroscopic constants for diatomics in the ground electronic state V, cm-1 xv, cm-1 B, cm-1 e, cm-1 R, 11.67 1.6326 0.01683 1.3117 13.46 1.9313 0.01896 1.1281 2.993 0.7416 0.3019 1.2746 0.000117 2.6666 0.01731 1.094 0.01579 0.714 12C2 12C160 H 1H35CI 1641.35 2170.21 4395.20 117.9 2989.74 52.05 214.57 2359.61 14.456 1580.36 12.073 82.81 12712 14N 1602 160H 3735.21 0.6127 60.80 10.59 0.03735 1.998 1.4456 18.871 1.20739 0.9706 Do, ev 3.6 10.96 4.476 4.430 1.5417 7.373 5.080 4.35
Step by Step Solution
3.46 Rating (156 Votes )
There are 3 Steps involved in it
In IR spectroscopy the Q branch represents transitions where there is no change in the rotational quantum number AJ 0 This means that the observed lin... View full answer

Get step-by-step solutions from verified subject matter experts