

Question: The graph in FIGURE EX40.16 shows the potential-energy function U(x) of a particle. Solution of the Schrdinger equation finds that the n = 3 level
The graph in FIGURE EX40.16 shows the potential-energy function U(x) of a particle. Solution of the Schrödinger equation finds that the n = 3 level has E3= 0.5 eV and that the n = 6 level has E6= 2.0 eV.
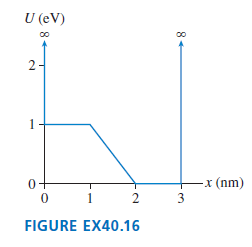
a. Redraw this figure and add to it the energy lines for the n = 3 and n = 6 states.b. Sketch the n = 3 and n = 6 wave functions. Show them as oscillating about the appropriate energy line.
U (eV) 2. 1 x (nm) 3 FIGURE EX40.16 8
Step by Step Solution
3.29 Rating (161 Votes )
There are 3 Steps involved in it
Visualize Solve a The energy diagram is shown above ... View full answer

Get step-by-step solutions from verified subject matter experts