Answered step by step
Verified Expert Solution
Question
1 Approved Answer
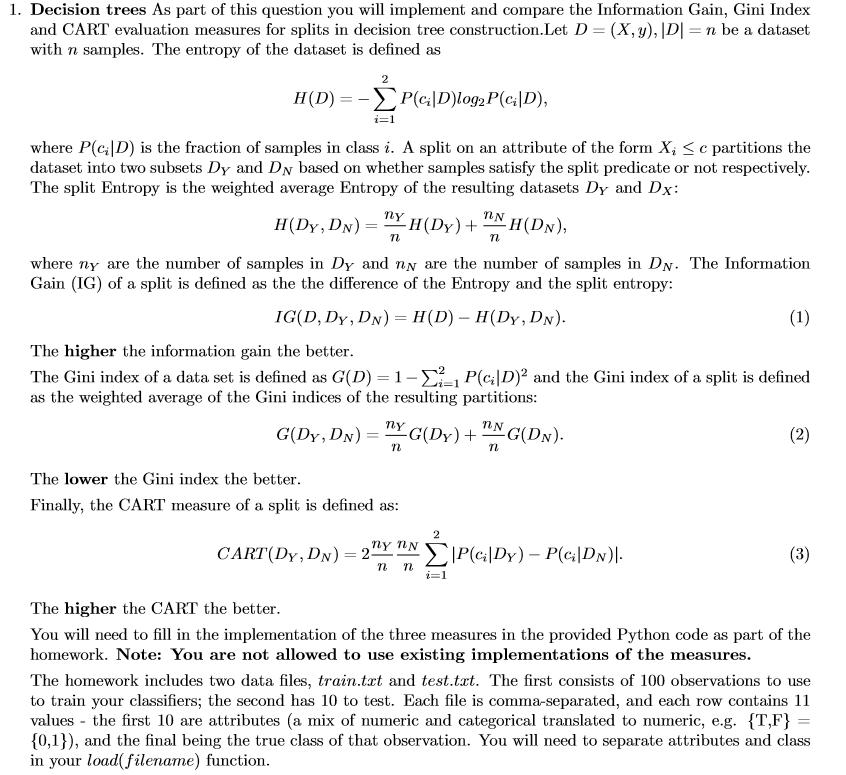
1. Decision trees As part of this question you will implement and compare the Information Gain, Gini Index and CART evaluation measures for splits


1. Decision trees As part of this question you will implement and compare the Information Gain, Gini Index and CART evaluation measures for splits in decision tree construction.Let D = (X, y), |D|= n be a dataset with n samples. The entropy of the dataset is defined as 2 H(D)=P(c|D)log2 P(ci|D), i=1 where P(c|D) is the fraction of samples in class i. A split on an attribute of the form X, c partitions the dataset into two subsets Dy and DN based on whether samples satisfy the split predicate or not respectively. The split Entropy is the weighted average Entropy of the resulting datasets Dy and Dx: ny H(Dy, DN) = -H(Dy)+ H(DN), n nN n where ny are the number of samples in Dy and ny are the number of samples in DN. The Information Gain (IG) of a split is defined as the the difference of the Entropy and the split entropy: IG(D, Dy, DN) = H(D) - H(Dy, DN). The higher the information gain the better. The Gini index of a data set is defined as G(D) = 1-- P(c;D) and the Gini index of a split is defined as the weighted average of the Gini indices of the resulting partitions: nN G(DY, DN) = G(DY) + TYG(DY) + N G(DN). n The lower the Gini index the better. Finally, the CART measure of a split is defined as: (1) 2 CART (DY, DN) = 2Y NP(ci Dy) - P(c|DN)|. n n i=1 (2) (3) The higher the CART the better. You will need to fill in the implementation of the three measures in the provided Python code as part of the homework. Note: You are not allowed to use existing implementations of the measures. The homework includes two data files, train.txt and test.txt. The first consists of 100 observations to use to train your classifiers; the second has 10 to test. Each file is comma-separated, and each row contains 11 values - the first 10 are attributes (a mix of numeric and categorical translated to numeric, e.g. {T,F} = {0,1}), and the final being the true class of that observation. You will need to separate attributes and class in your load(filename) function. (a) [10 pts.] Implement the IG(D, inder, value) function according to equation 1, where D is a dataset, index is the index of an attribute and value is the split value such that the split is of the form X, value. The function should return the value of the information gain. (b) [10 pts.] Implement the G(D, index, value) function according to equation 2, where D is a dataset, inder is the index of an attribute and value is the split value such that the split is of the form X < value. The function should return the value of the gini index value.
Step by Step Solution
★★★★★
3.49 Rating (152 Votes )
There are 3 Steps involved in it
Step: 1
importing libraries import numpy as nm import matplotlibpyplot as mtp import pandas as pd importing ...
Get Instant Access to Expert-Tailored Solutions
See step-by-step solutions with expert insights and AI powered tools for academic success
Step: 2

Step: 3

Ace Your Homework with AI
Get the answers you need in no time with our AI-driven, step-by-step assistance
Get Started


