

Question
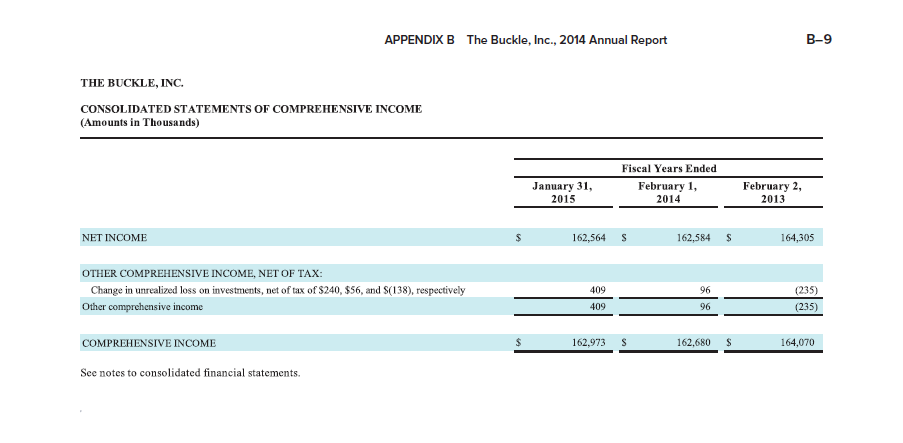
1) Prepare an Operating Asset Management Analysis by calculating for each company the : a) current ratio b) quick ratio c) receivables turnover d) days
1) Prepare an Operating Asset Management Analysis by calculating for each company the :
a) current ratio b) quick ratio c) receivables turnover d) days sales uncollected e) inventory turnover f) days inventory on hand g) payables turnover h) days payable i) financing period
2) Prepare a Profitability And Total Asset Management Analysis by calculating for each company the:
a) profit margin b) asset turnover c) return on assets
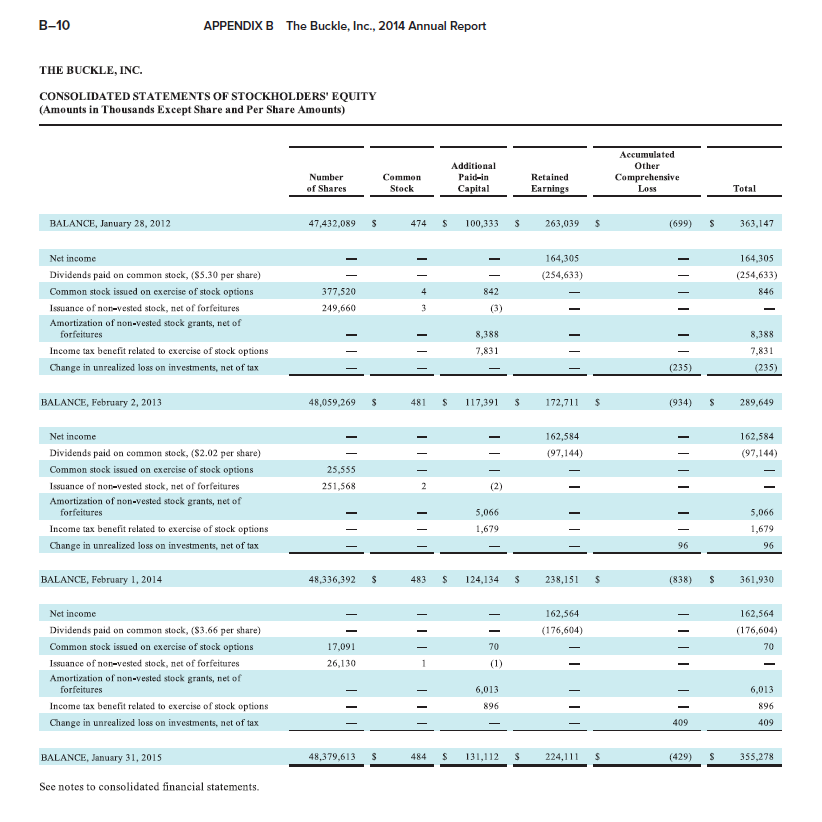
3) Prepare a Financial Risk Analysis by calculating for each company the:
a) debt to equity ratio b) return on equity c) interest coverage ratio*
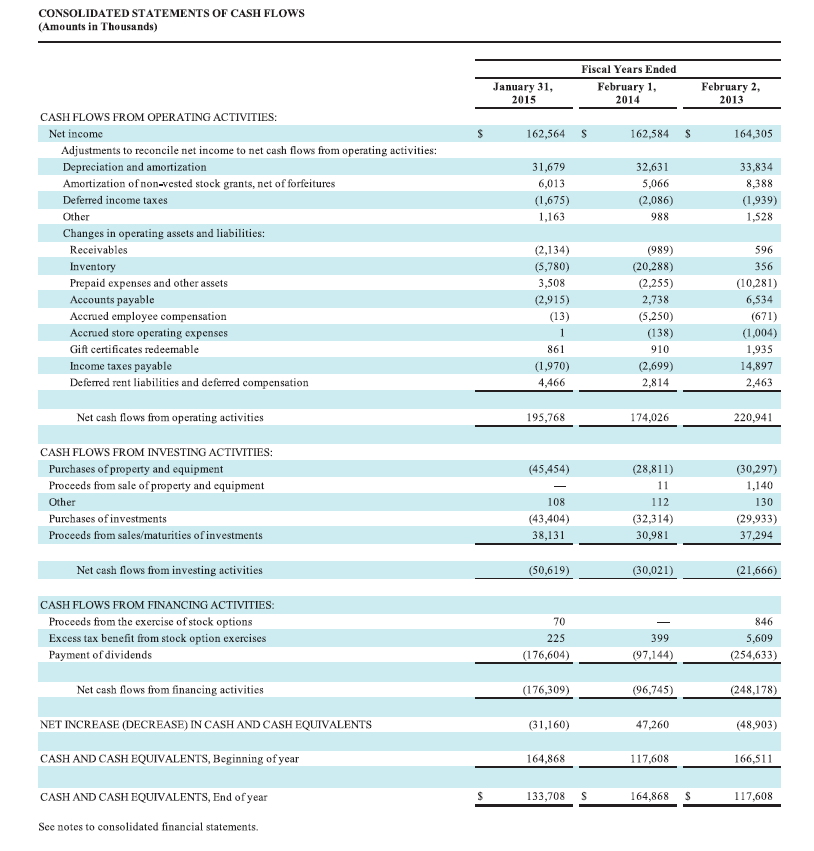
4) Prepare a Liquidity Analysis by calculating for each company the cash flow yield
a) Cash flows to sales b) Cash flows to assets c) Free cash flows
5) Prepare An Analysis Of Market Strength by calculating for each company the:
a) price/earnings ratio
b) dividend yield
6) Once you have completed the first 5 steps, write a 1-2 page analysis of the Buckle . What is the strengths, weaknesses, etc.? Why would you invest ot not?
Step by Step Solution
There are 3 Steps involved in it
Step: 1

Get Instant Access to Expert-Tailored Solutions
See step-by-step solutions with expert insights and AI powered tools for academic success
Step: 2

Step: 3
Ace Your Homework with AI
Get the answers you need in no time with our AI-driven, step-by-step assistance
Get Started
Derivatives Markets
Authors: Robert McDonald
3rd Edition
978-9332536746, 9789332536746