Answered step by step
Verified Expert Solution
Question
1 Approved Answer
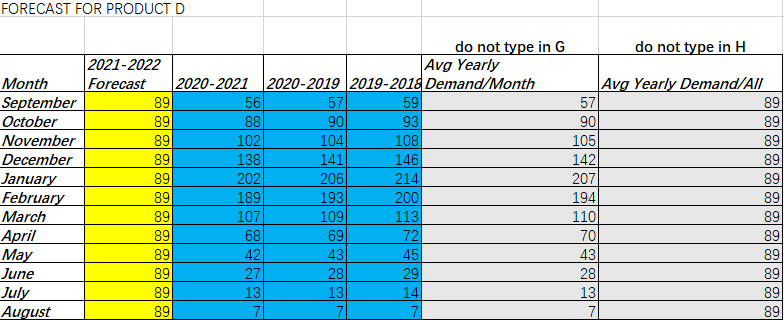
8. This question pertains to the Quiz spreadsheet accessible in the Canvas tab for Week 5. Refer to the Seasonality tab. After graphing the data

8. This question pertains to the Quiz spreadsheet accessible in the Canvas tab for Week 5. Refer to the Seasonality tab. After graphing the data for the 3 years, which of the following is true?
A.The forecast could be improved if a 4th year of data was dropped (2018-2019)
B.The forecast could be improved if a 4th year of data was added (2017-2018)
C.Using a seasonal index to forecast for 2021-2022 would cause a higher MAD than the current forecast of 89.
D.Product D does not show seasonality
FORECAST FOR PRODUCT D do not type in H do not type in G 2021-2022 Avg Yearly Month Forecast 2020-2021 2020-2019 2019-2018 Demand/Month September 89 56 57 59 October 89 88 90 93 November 89 102 104 108 December 89 138 141 146 January 89 202 206 214 February 89 189 193 200 March 89 107 109 113 April 89 68 69 72 May 89 42 43 45 June 89 27 28 29 July 89 13 131 14 August 89 7 7 7 B Avg Yearly Demand/All 57 89 90 89 105 89 142 89 207 89 194 89 110 89) 70 89 43 89 28 89 13 89 7 89 FORECAST FOR PRODUCT D do not type in H do not type in G 2021-2022 Avg Yearly Month Forecast 2020-2021 2020-2019 2019-2018 Demand/Month September 89 56 57 59 October 89 88 90 93 November 89 102 104 108 December 89 138 141 146 January 89 202 206 214 February 89 189 193 200 March 89 107 109 113 April 89 68 69 72 May 89 42 43 45 June 89 27 28 29 July 89 13 131 14 August 89 7 7 7 B Avg Yearly Demand/All 57 89 90 89 105 89 142 89 207 89 194 89 110 89) 70 89 43 89 28 89 13 89 7 89Step by Step Solution
There are 3 Steps involved in it
Step: 1

Get Instant Access to Expert-Tailored Solutions
See step-by-step solutions with expert insights and AI powered tools for academic success
Step: 2

Step: 3

Ace Your Homework with AI
Get the answers you need in no time with our AI-driven, step-by-step assistance
Get Started


