Answered step by step
Verified Expert Solution
Question
1 Approved Answer
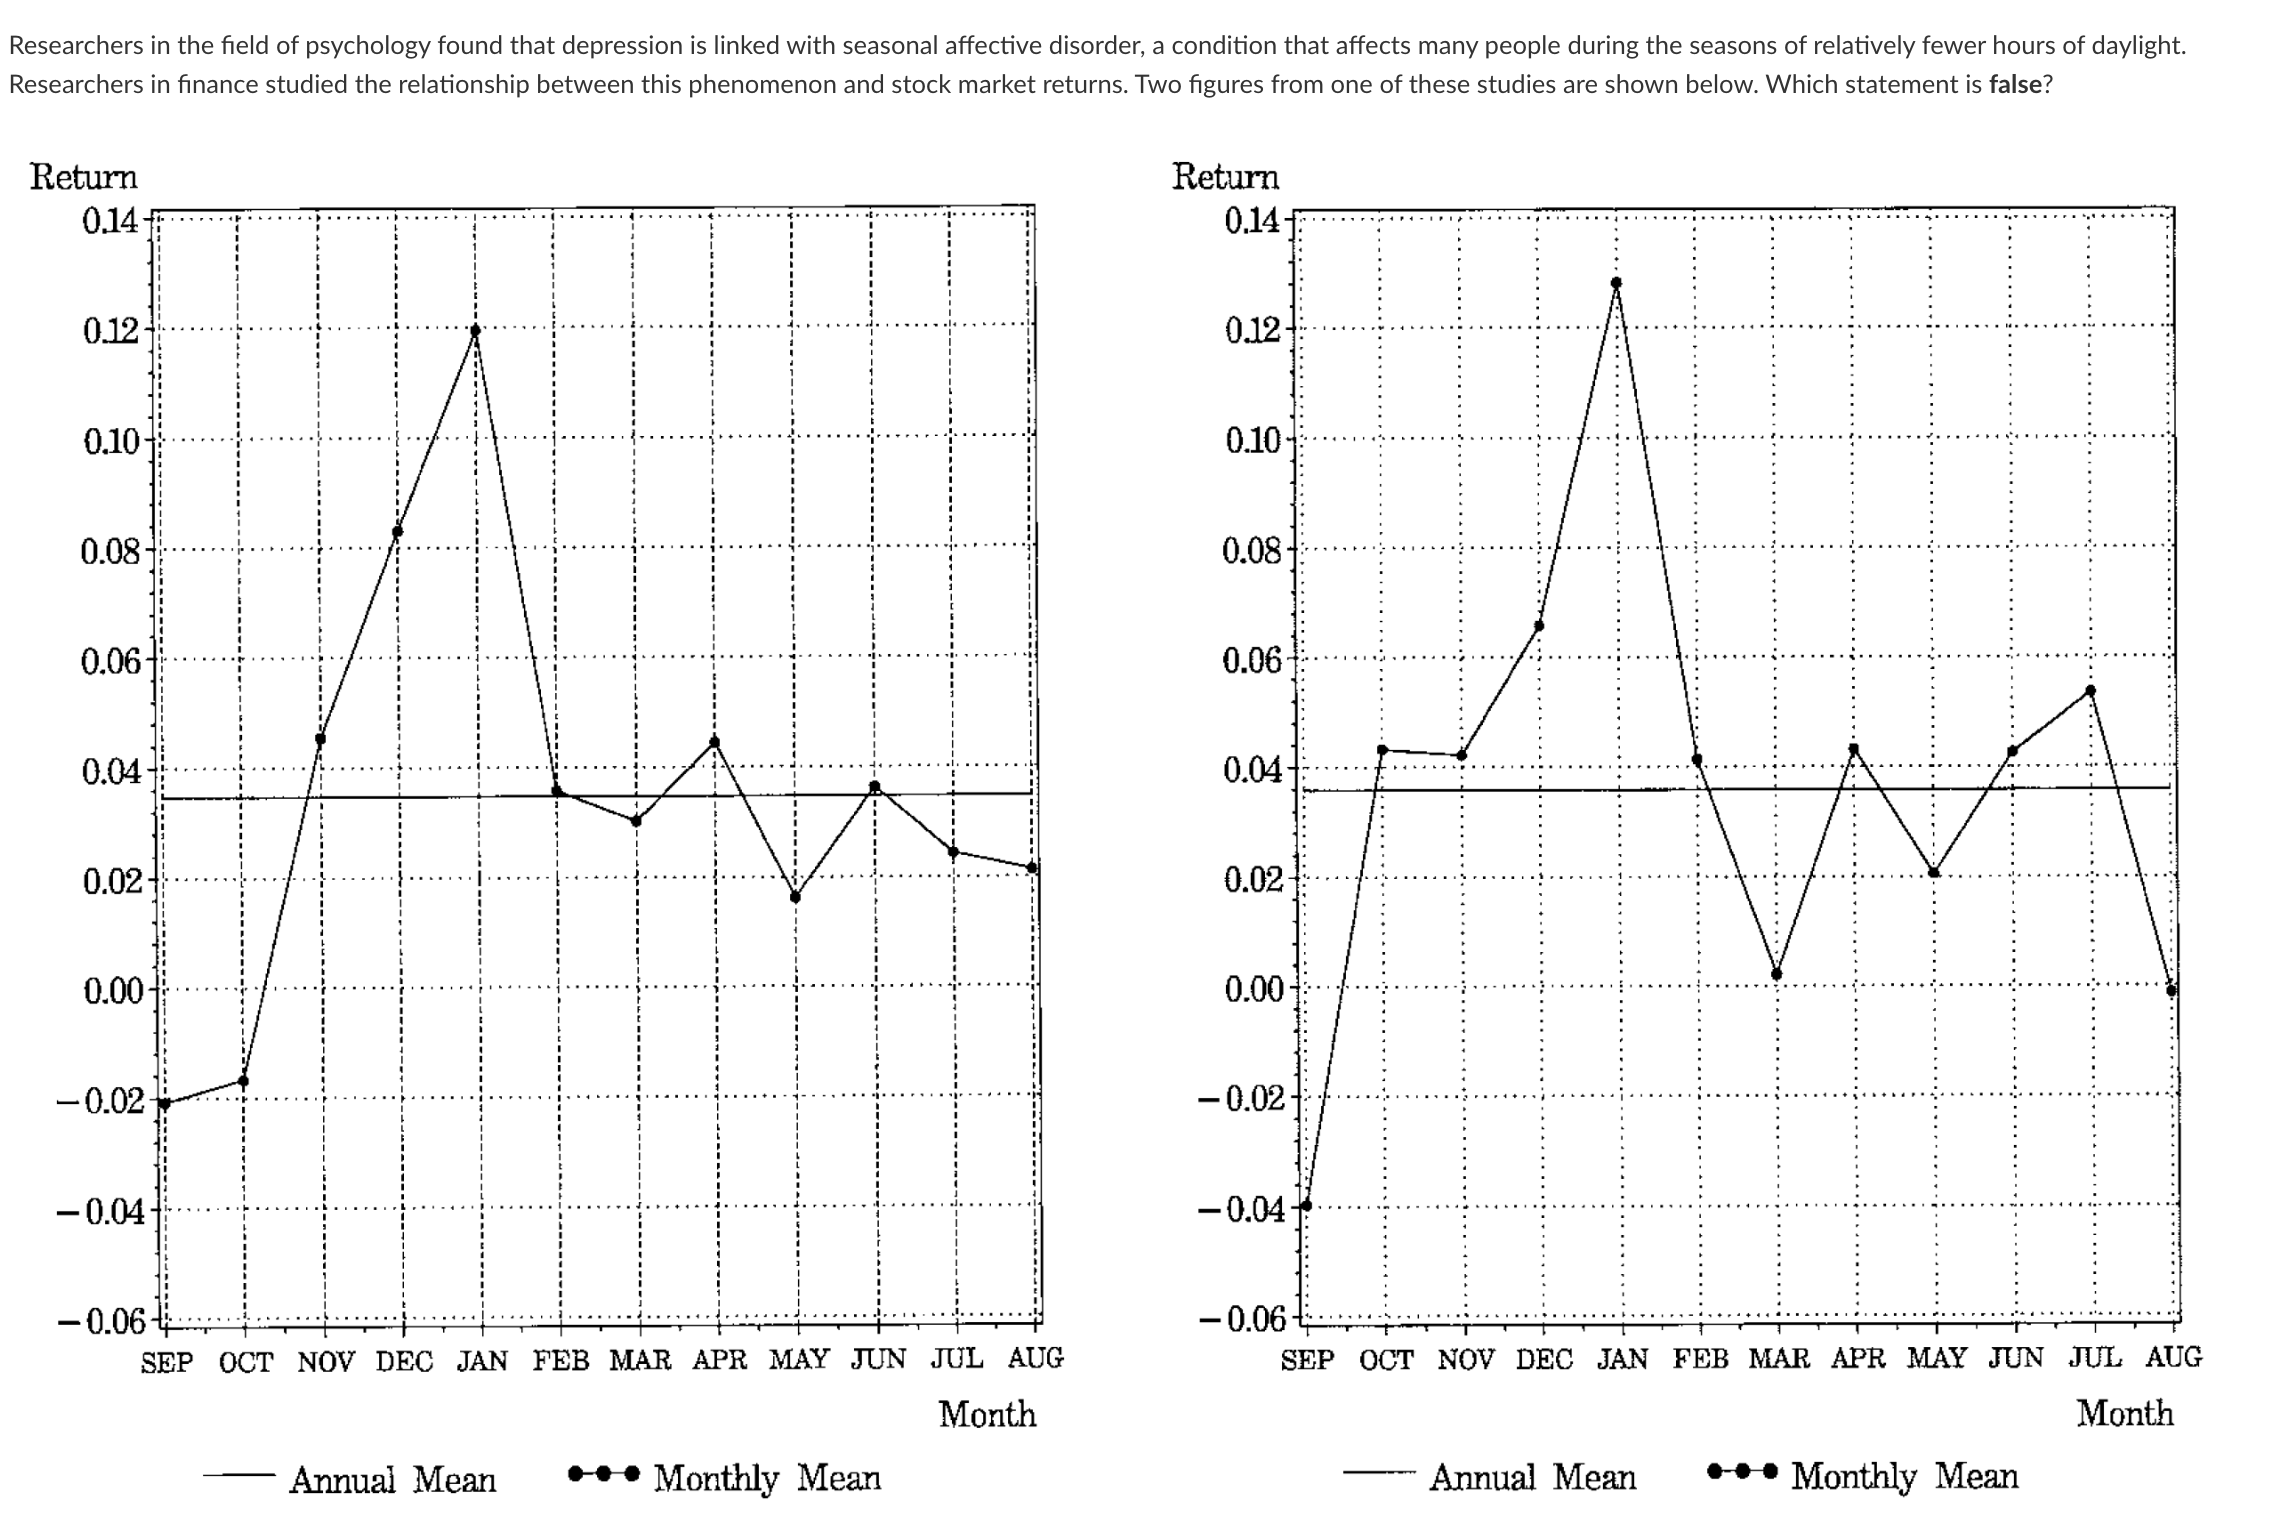
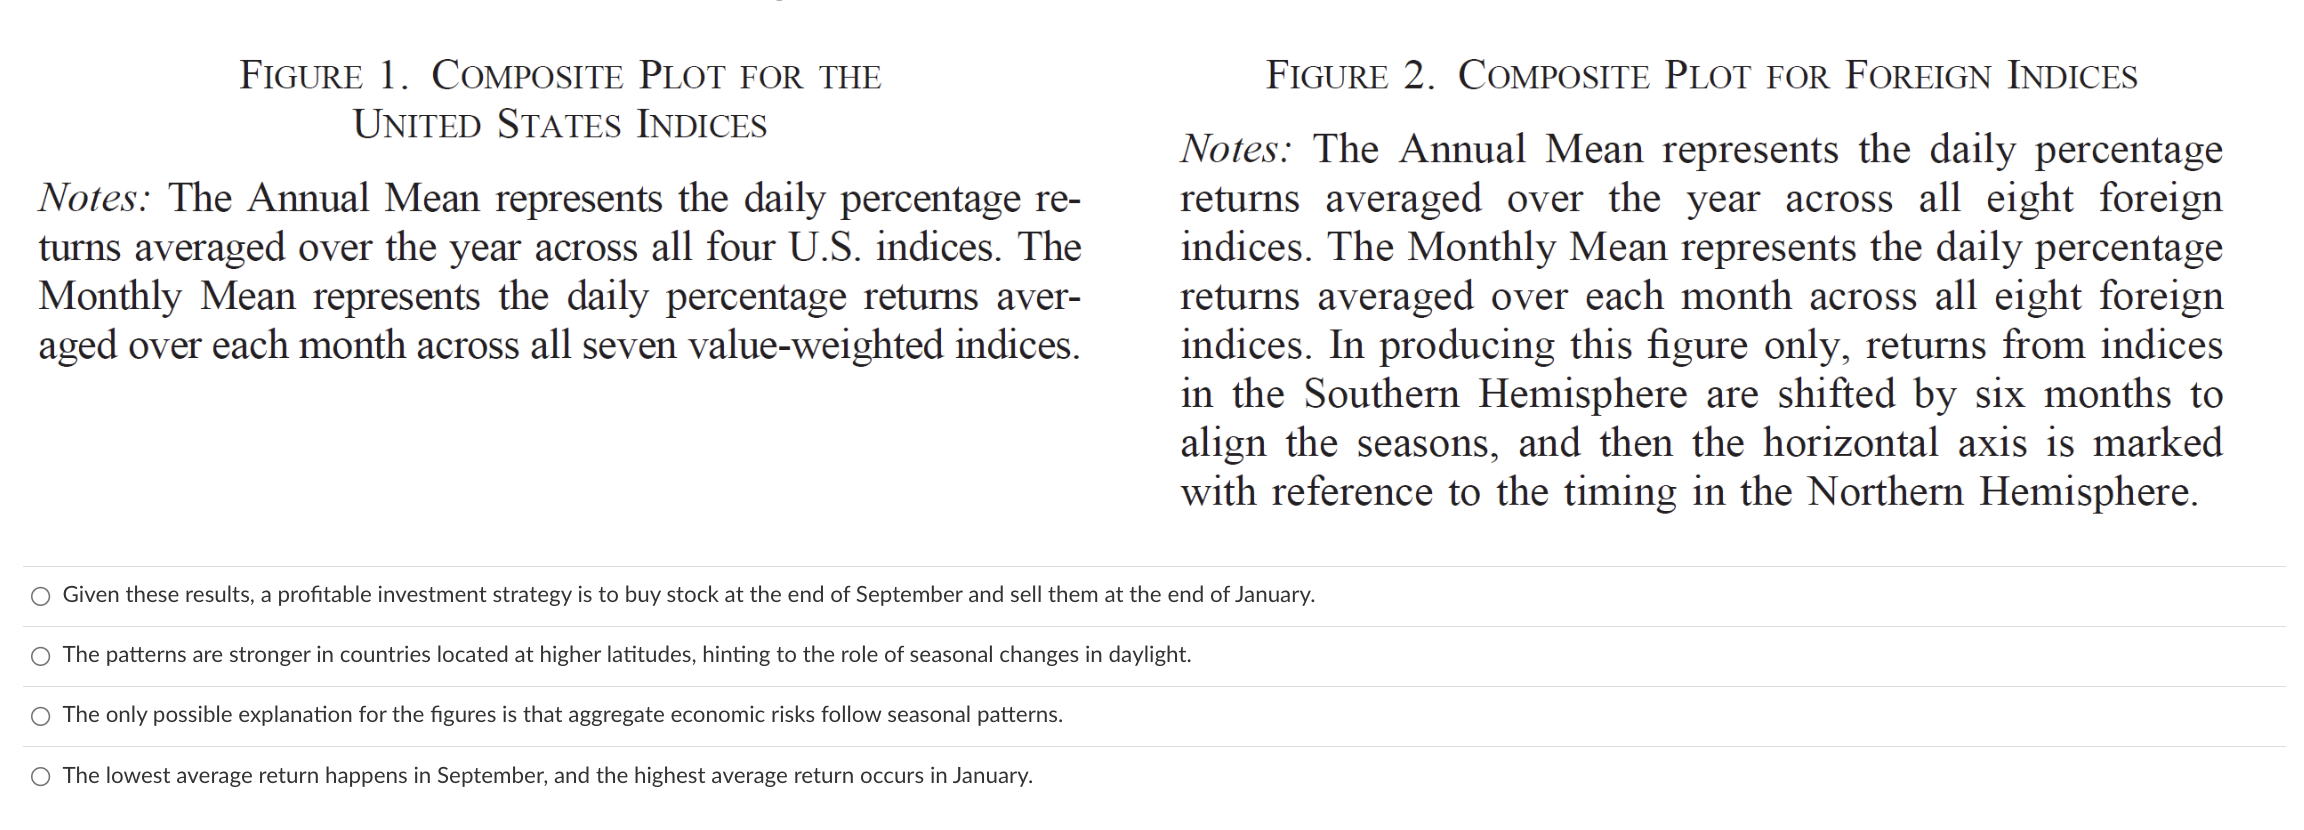
Annual Mean Monthly Mean Annual Mean Monthly Mean Figure 1. Composite Plot for the UNITED STATES INDICES Notes: The Annual Mean represents the daily percentage

 Annual Mean Monthly Mean Annual Mean Monthly Mean Figure 1. Composite Plot for the UNITED STATES INDICES Notes: The Annual Mean represents the daily percentage returns averaged over the year across all four U.S. indices. The Monthly Mean represents the daily percentage returns averaged over each month across all seven value-weighted indices. Figure 2. Composite Plot for Foreign Indices Notes: The Annual Mean represents the daily percentage returns averaged over the year across all eight foreign indices. The Monthly Mean represents the daily percentage returns averaged over each month across all eight foreign indices. In producing this figure only, returns from indices in the Southern Hemisphere are shifted by six months to align the seasons, and then the horizontal axis is marked with reference to the timing in the Northern Hemisphere. Given these results, a profitable investment strategy is to buy stock at the end of September and sell them at the end of January. The patterns are stronger in countries located at higher latitudes, hinting to the role of seasonal changes in daylight. The only possible explanation for the figures is that aggregate economic risks follow seasonal patterns. The lowest average return happens in September, and the highest average return occurs in January
 Step by Step Solution
There are 3 Steps involved in it
Step: 1

Get Instant Access to Expert-Tailored Solutions
See step-by-step solutions with expert insights and AI powered tools for academic success
Step: 2

Step: 3

Ace Your Homework with AI
Get the answers you need in no time with our AI-driven, step-by-step assistance
Get Started


