

Answered step by step
Verified Expert Solution
Question
1 Approved Answer
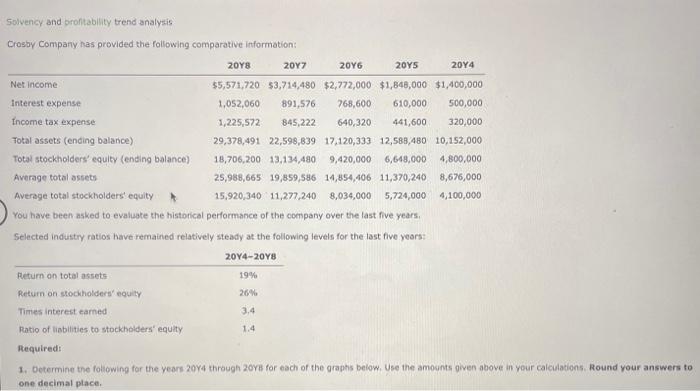
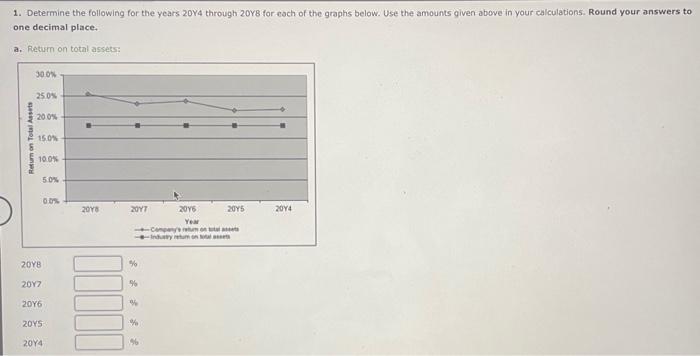
b. Return on stockholders' equity: 1. Determine the following for the years 20Y4 through 20Y8 for each of the graphs below. Use the amounts given
Step by Step Solution
There are 3 Steps involved in it
Step: 1

Get Instant Access to Expert-Tailored Solutions
See step-by-step solutions with expert insights and AI powered tools for academic success
Step: 2

Step: 3
Ace Your Homework with AI
Get the answers you need in no time with our AI-driven, step-by-step assistance
Get Started
The Accounting And Financial Audit
Authors: Landry Kouamé
1st Edition
620430481X, 978-6204304816