Answered step by step
Verified Expert Solution
Question
1 Approved Answer
Begin by performing a vertical analysis of Sigma Designs' balance sheet for 2018, then perform the analysis for 2017. (Round the percent f total amounts
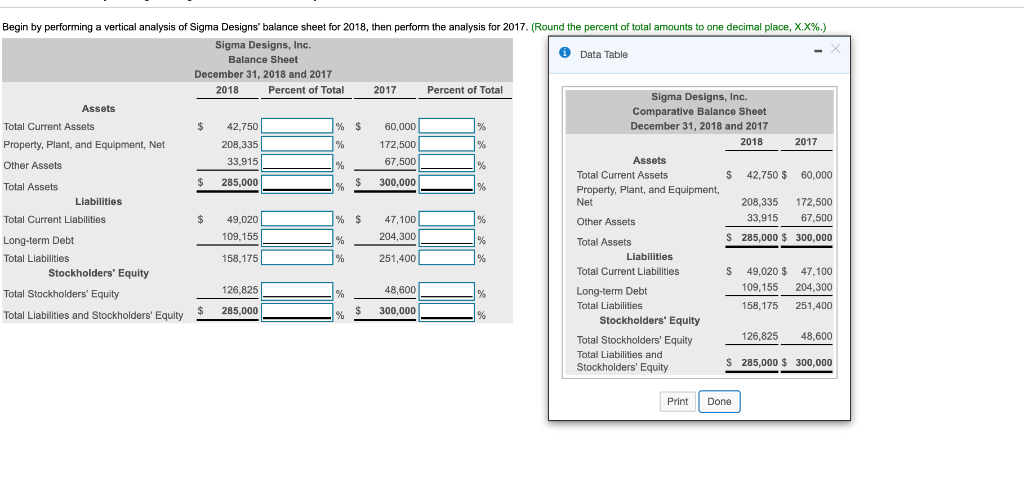
Begin by performing a vertical analysis of Sigma Designs' balance sheet for 2018, then perform the analysis for 2017. (Round the percent f total amounts to one decimal place, X.X %.) Sigma Designs, Inc. Data Table Balance Sheet December 31, 2018 and 2017 2018 Percent of Total 2017 Percent of Total Sigma Designs, Inc Assets Comparative Balance Sheet December 31, 2018 and 2017 % Total Current Assets 42,750 60,000 % 2018 2017 % Property, Plant, and Equipment, Net 208.335 172,500 Assets 33,915 67,500 Other Assets Total Current Assets 42,750 $ 60,000 285.000 300,000 Total Assets Property, Plant, and Equipment, Net Liabilities 208,335 172,500 % S 33.915 67,500 Total Current Liabilities 49,020 47,100 Other Assets 204.300 109.155 S 285,000 $ 300,000 Total Assets Long-term Debt Total Liabilities 251,400 jabilities 158,175 % Total Current Liabilities 49,020 $ 47,100 Stockholders' Equity 109,155 204,300 126.825 48,600 Long-term Debt Total Stockholders' Equity % Tot 158,175 251,400 285,000 300,000 Total Liabilities and Stockholders' Equity Stockholders' Equity 126,825 48.600 Total Stockholders' Equity S 285,000 $300,000 Stockholderet Print Done
Step by Step Solution
There are 3 Steps involved in it
Step: 1
Get Instant Access to Expert-Tailored Solutions
See step-by-step solutions with expert insights and AI powered tools for academic success
Step: 2
Step: 3
Ace Your Homework with AI
Get the answers you need in no time with our AI-driven, step-by-step assistance
Get Started