

Question
Calculate the number of molecules of air in VB (V1+V2+V3+V4+V5+V6) + V7 + VD when the pressure is a. 10-3 torr, and b. 10-5 torr
Calculate the number of molecules of air in VB (V1+V2+V3+V4+V5+V6) + V7 + VD when the pressure is a. 10-3 torr, and b. 10-5 torr Show how equation (5) is obtained
these are the information i got i don't have any other extra information please help me out in this...
please help me to calculate number of the
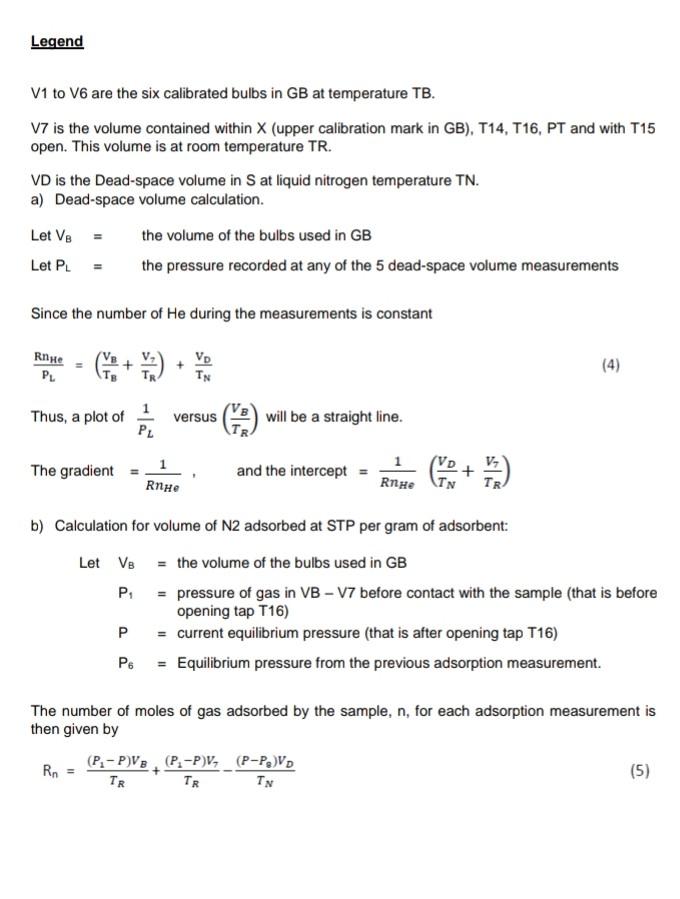
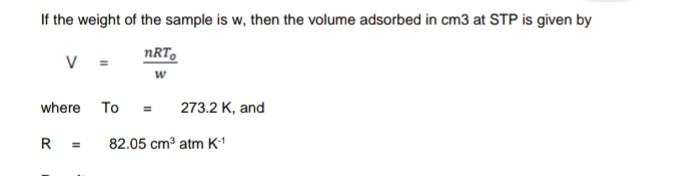
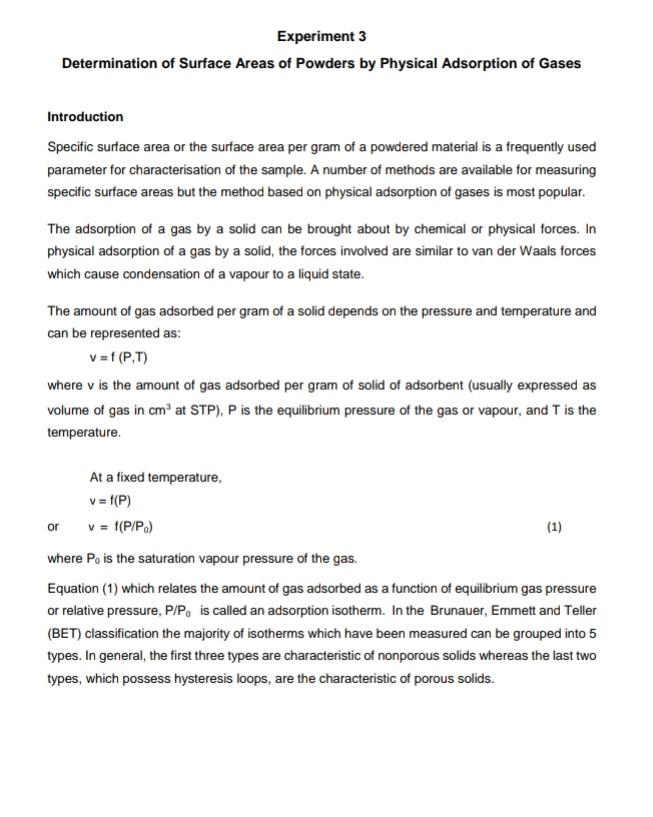
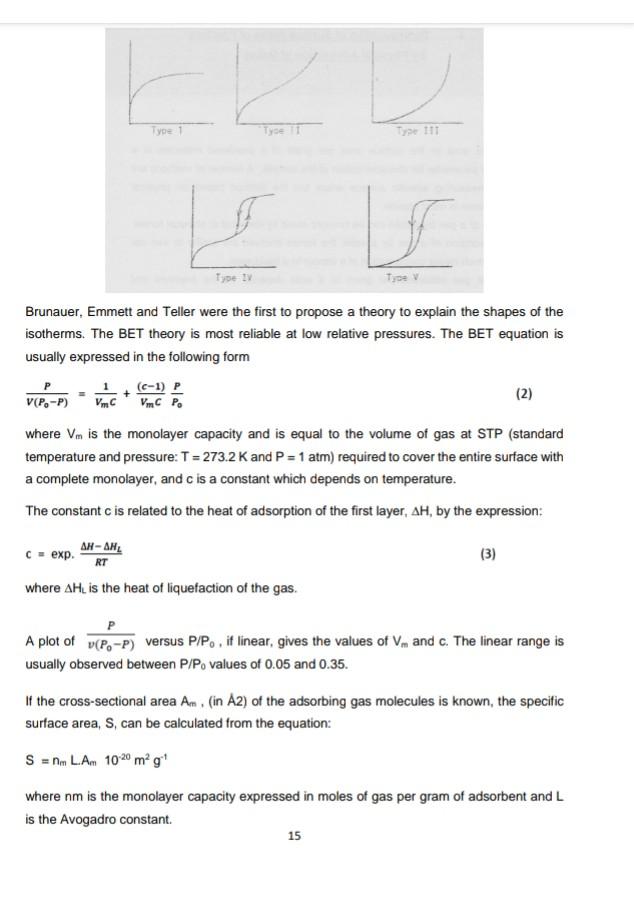
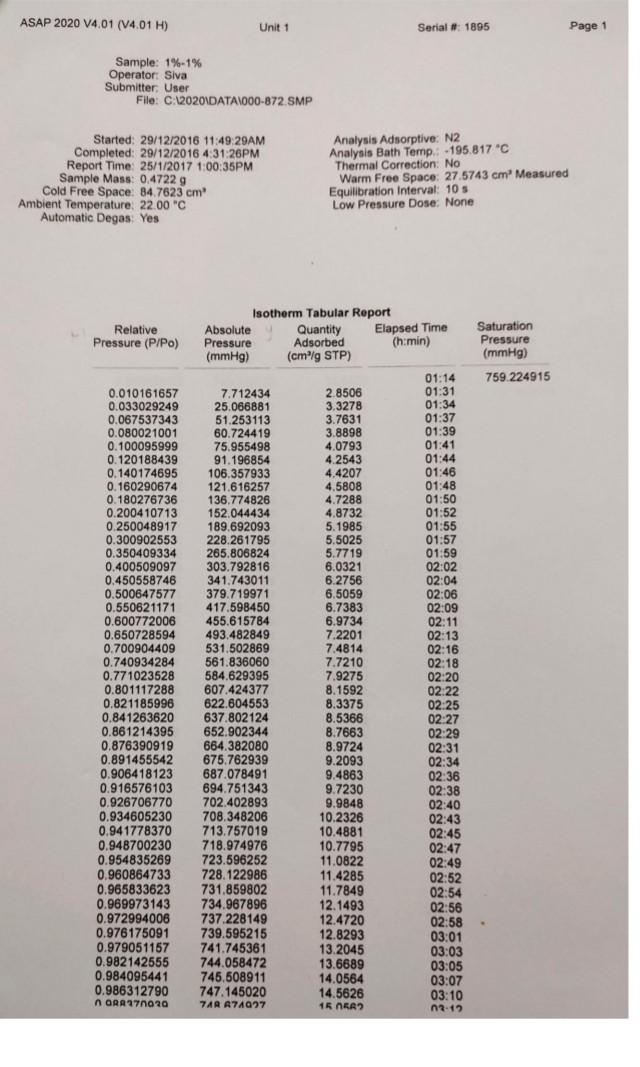
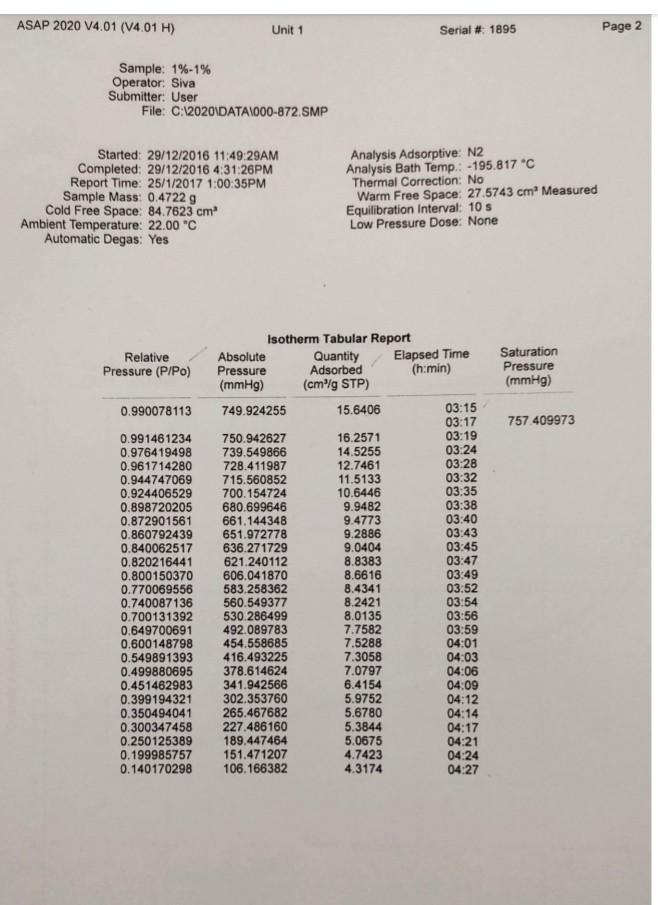
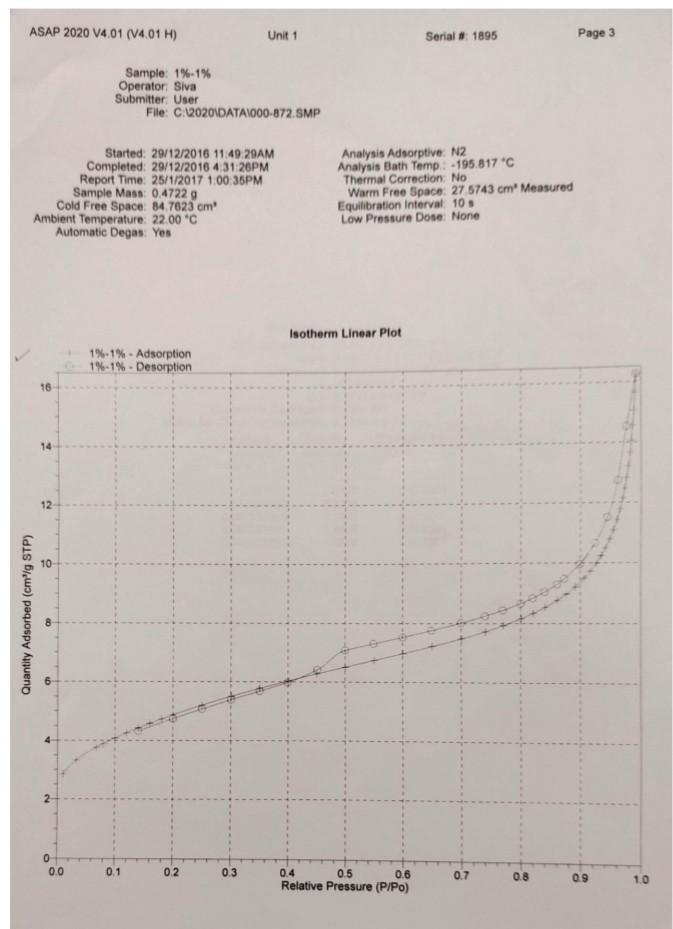
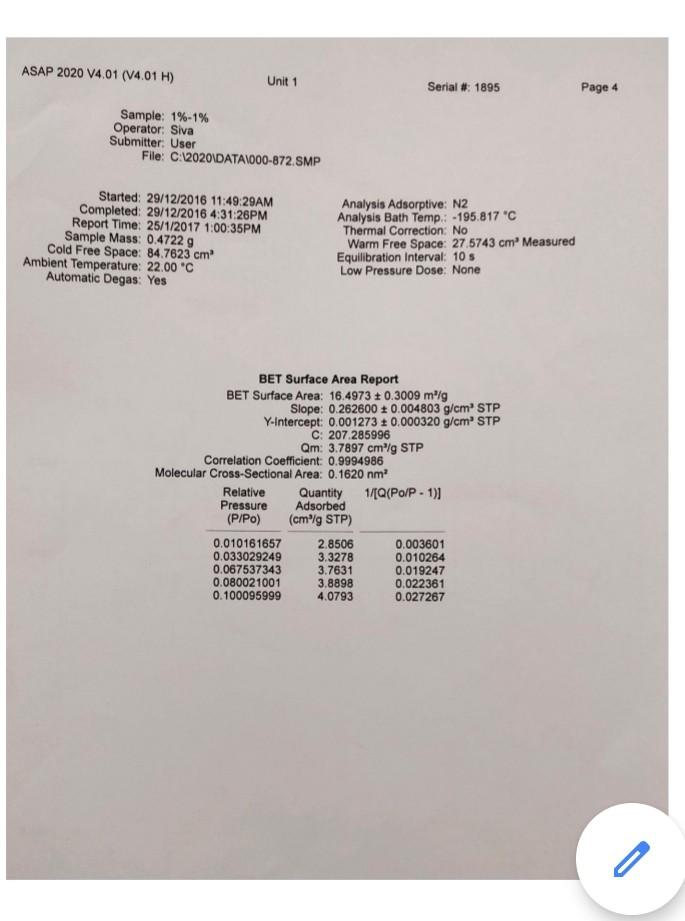
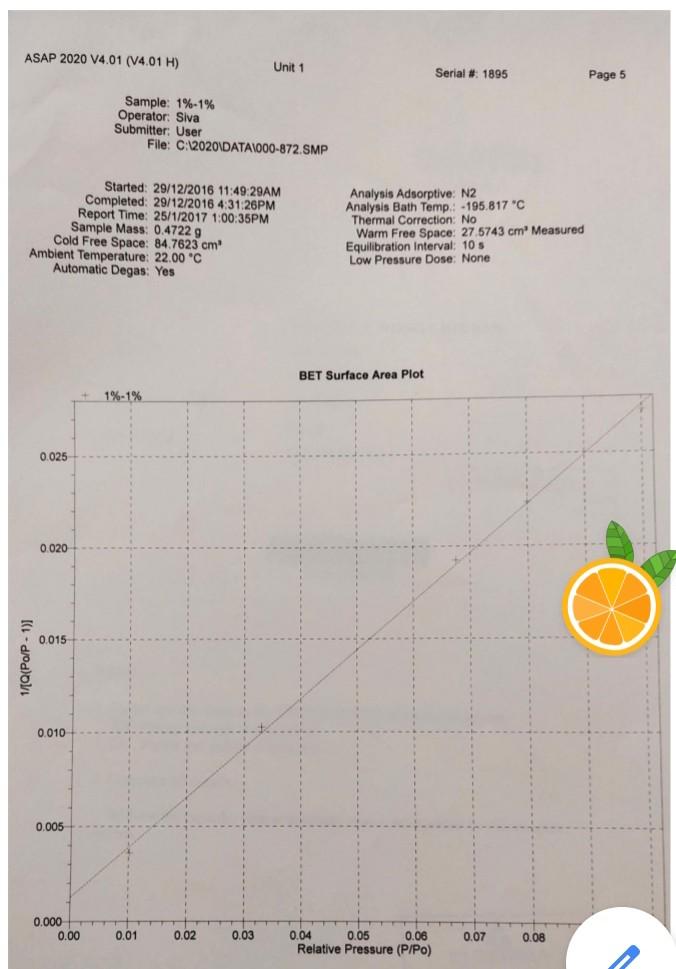
Legend V1 to V6 are the six calibrated bulbs in GB at temperature TB. V7 is the volume contained within X (upper calibration mark in GB), T14, T16, PT and with T15 open. This volume is at room temperature TR. VD is the Dead-space volume in S at liquid nitrogen temperature TN. a) Dead-space volume calculation. Let Ve the volume of the bulbs used in GB Let PL = the pressure recorded at any of the 5 dead-space volume measurements Since the number of He during the measurements is constant Rnye Vp TN (4) PL Thus, a plot of 1 PL versus (9) will be a straight line. V, The gradient = RnHe and the intercept = ) RnHe b) Calculation for volume of N2 adsorbed at STP per gram of adsorbent: Let VB = the volume of the bulbs used in GB P = pressure of gas in VB - V7 before contact with the sample (that is before opening tap T16) P = current equilibrium pressure that is after opening tap T16) P. = Equilibrium pressure from the previous adsorption measurement. The number of moles of gas adsorbed by the sample, n, for each adsorption measurement is then given by Rn (P.-P)VB. (P.-P)V, (P-P.)V TR TN TR (5) If the weight of the sample is w, then the volume adsorbed in cm3 at STP is given by V NRT, w where To = 273.2 K, and R = 82.05 cm atm k! Experiment 3 Determination of Surface Areas of Powders by Physical Adsorption of Gases Introduction Specific surface area or the surface area per gram of a powdered material is a frequently used parameter for characterisation of the sample. A number of methods are available for measuring specific surface areas but the method based on physical adsorption of gases is most popular. The adsorption of a gas by a solid can be brought about by chemical or physical forces. In physical adsorption of a gas by a solid, the forces involved are similar to van der Waals forces which cause condensation of a vapour to a liquid state. The amount of gas adsorbed per gram of a solid depends on the pressure and temperature and can be represented as: V = f (PT) where v is the amount of gas adsorbed per gram of solid of adsorbent (usually expressed as volume of gas in cm at STP), P is the equilibrium pressure of the gas or vapour, and T is the temperature At a fixed temperature, v = f(P) or v = f(P/P.) (1) where Po is the saturation vapour pressure of the gas. Equation (1) which relates the amount of gas adsorbed as a function of equilibrium gas pressure or relative pressure, PIP, is called an adsorption isotherm. In the Brunauer, Emmett and Teller (BET) classification the majority of isotherms which have been measured can be grouped into 5 types. In general, the first three types are characteristic of nonporous solids whereas the last two types, which possess hysteresis loops, are the characteristic of porous solids. 2 Type 1 Type IT Type IV Type + (2) Brunauer, Emmett and Teller were the first to propose a theory to explain the shapes of the isotherms. The BET theory is most reliable at low relative pressures. The BET equation is usually expressed in the following form (C-1) P V(Po-P) where Vm is the monolayer capacity and is equal to the volume of gas at STP (standard temperature and pressure: T = 273.2 K and P=1 atm) required to cover the entire surface with a complete monolayer, and C is a constant which depends on temperature. The constant is related to the heat of adsorption of the first layer, AH, by the expression: (3) . x. - . RT where AH is the heat of liquefaction of the gas. A plot of v(Po-P) versus P/P., if linear, gives the values of Vm and c. The linear range is usually observed between P/P, values of 0.05 and 0.35. If the cross-sectional area Am. (in A2) of the adsorbing gas molecules is known, the specific surface area, S, can be calculated from the equation: S = nm L.Am 10-20 mg where nm is the monolayer capacity expressed in moles of gas per gram of adsorbent and L is the Avogadro constant 15 ASAP 2020 V4.01 (V4.01 H) Unit 1 Serial # 1895 Page 1 Sample: 1%-1% Operator: Siva Submitter. User File:C:2020\DATA\000-872. SMP Started: 29/12/2016 11:49:29AM Completed: 20/12/2016 4:31:26PM Report Time: 25/1/2017 1:00:35PM Sample Mass: 0.4722 g Cold Free Space: 84.7623 cm Ambient Temperature: 22.00 "C Automatic Degas: Yes Analysis Adsorptive: N2 Analysis Bath Temp.: -195.817C Thermal Correction: No Warm Free Space: 27.5743 cm Measured Equilibration Interval: 10 s Low Pressure Dose: None Relative Pressure (P/Po) 0.010161657 0.033029249 0.067537343 0.080021001 0.100095999 0.120188439 0.140174695 0.160290674 0.180276736 0.2004 10713 0.250048917 0.300902553 0.350409334 0.400509097 0.450558746 0.500647577 0.550621171 0.600772006 0.650728594 0.700904409 0.740934284 0.771023528 0.801117288 0.821185996 0.841263620 0.861214395 0.876390919 0.891455542 0.906418123 0.916576103 0.926706770 0.934605230 0.941778370 0.948700230 0.954835269 0.960864733 0.965833623 0.969973143 0.972994006 0.976175091 0.979051157 0.982142555 0.984095441 0.986312790 ORA 179020 Isotherm Tabular Report Absolute Quantity Elapsed Time Saturation Pressure Adsorbed (h:min) Pressure (mmHg) (cm/g STP) (mmHg) 01:14 759 224915 7.712434 2.8506 01:31 25.066881 3.3278 01:34 51.253113 3.7631 01:37 60.724419 3.8898 01:39 75.955498 4.0793 01:41 91.196854 4.2543 01:44 106.357933 4.4207 01:46 121.616257 4.5808 01:48 136.774826 4.7288 01:50 152.044434 4.8732 01:52 189.692093 5.1985 01:55 228.261795 5.5025 01:57 265.806824 5.7719 01:59 303.792816 6.0321 02:02 341.743011 6.2756 02:04 379.719971 6.5059 02:06 417.598450 6.7383 02:09 455.615784 6.9734 02:11 493.482849 7.2201 02:13 531.502869 7.4814 02:16 561.836060 7.7210 02:18 584.629395 7.9275 02:20 607.424377 8.1592 02:22 622.604553 8.3375 02:25 637.802124 8.5366 02:27 652.902344 8.7663 02:29 664.382080 8.9724 02:31 675.762939 9.2093 02:34 687.078491 9.4863 02:36 694.751343 9.7230 02:38 702.402893 9.9848 02:40 708,348206 10.2326 02:43 713.757019 10.4881 02:45 718.974976 10.7795 02:47 723.596252 11.0822 02:49 728.122986 11.4285 02:52 731.859802 11.7849 02:54 734.967896 12.1493 02:56 737.228149 12.4720 02:58 . 739.595215 12.8293 03:01 741.745361 13.2045 03:03 744.058472 13.6689 03:05 745.508911 14.0564 03:07 747.145020 14.5626 03:10 74A A74027 16 OKA2 ) ASAP 2020 V4.01 (V4.01 H) Unit 1 Serial # 1895 Page 2 Sample: 1%-1% Operator: Siva Submitter: User File: C:\2020 DATA1000-872.SMP Started: 29/12/2016 11:49:29AM Completed: 29/12/2016 4:31:26PM Report Time: 25/1/2017 1:00:35PM Sample Mass: 0.4722 g Cold Free Space: 84.7623 cm Ambient Temperature: 22.00 C Automatic Degas: Yes Analysis Adsorptive: N2 Analysis Bath Temp.: -195.817 C Thermal Correction: No Warm Free Space: 27.5743 cm Measured Equilibration Interval: 10 s Low Pressure Dose: None Relative Pressure (P/Po) Saturation Pressure (mmHg) 0.990078113 757 409973 0.991461234 0.976419498 0.961714280 0.944747069 0.924406529 0.898720205 0.872901561 0.860792439 0.840062517 0.820216441 0.800150370 0.770069556 0.740087136 0.700131392 0.649700691 0.600148798 0.549891393 0.499880695 0.451462983 0.399194321 0.350494041 0.300347458 0.250125389 0.199985757 0.140170298 Isotherm Tabular Report Absolute Quantity Elapsed Time Pressure Adsorbed (h:min) (mmHg) (cm/g STP) 749.924255 15.6406 03:15 03:17 750.942627 16.257 03:19 739.549866 14.5255 03:24 728.411987 12.7461 03:28 715.560852 11.5133 03:32 700.154724 10.6446 03:35 680.699646 9.9482 03:38 661.144348 9.4773 03:40 651.972778 9.2886 03:43 636.271729 9.0404 03:45 621.240112 8.8383 03:47 606.041870 8.6616 03:49 583.258362 8.4341 03:52 560.549377 8.2421 03:54 530.286499 8.0135 03:56 492.089783 7.7582 03:59 454.558685 7.5288 04:01 416.493225 7.3058 04:03 378.614624 7.0797 04:06 341.942566 6.4154 04:09 302.353760 5.9752 04:12 265.467682 5.6780 04:14 227.486160 5.3844 04:17 189.447464 5.0675 04:21 151.471207 4.7423 04:24 106.166382 4.3174 04:27 ASAP 2020 V4.01 (V4.01 H) Unit 1 Serial # 1895 Page 3 Sample: 1%-1% Operator Siva Submitter: User File: C:620201DATA\000-872. SMP Started: 29/12/2016 11:49:29AM Completed: 29/12/2016 4:31:26PM Report Time: 26/1/2017 1:00:35PM Sample Mass: 0.4722 9 Cold Free Space: 14.7623 cm Ambient Temperature: 22.00 C Automatic Degas: Yes Analysis Adsorptive: N2 Analysis Bath Temp: -195.817 "C Thermal Correction: No Warm Free Space: 27 5743 cm Measured Equilibration Interval 105 Low Pressure Dose: None Isotherm Linear Plot 1% 1%. Adsorption 1%-1% - Desorption 10 14 12 10 Quantity Adsorbed (cm'lg STP) 2 0 0.0 0.1 02 0.3 0.7 0.8 0.4 0.5 0.6 Relative Pressure (P/Po) 09 1.0 ASAP 2020 V4.01 (V4.01 H) Unit 1 Serial #: 1895 Page 4 Sample: 1%-1% Operator: Siva Submitter: User File: C:\2020\DATA\000-872.SMP Started: 29/12/2016 11:49:29AM Completed: 29/12/2016 4:31:26PM Report Time: 25/1/2017 1:00:35PM Sample Mass: 0.4722 9 Cold Free Space: 84.7623 cm Ambient Temperature: 22.00 C Automatic Degas: Yes Analysis Adsorptive: N2 Analysis Bath Temp.: -195.817 "C Thermal Correction: No Warm Free Space: 27.5743 cm. Measured Equilibration Interval: 10 s Low Pressure Dose: None BET Surface Area Report BET Surface Area: 16.4973 +0.3009 mig Slope: 0.262600 0.004803 g/cm STP Y-Intercept: 0.001273 : 0.000320 g/cm' STP C: 207.285996 Qm: 3.7897 cm g STP Correlation coefficient: 0.9994986 Molecular Cross-Sectional Area: 0.1620 nm Relative Quantity 1/[Q(Po/P-1)] Pressure Adsorbed (P/Po) (cmg STP) 0.010161657 2.8506 0.003601 0.033029249 3.3278 0.010264 0.067537343 3.7631 0.019247 0.080021001 3.8898 0.022361 0.100095999 4.0793 0.027267 ASAP 2020 V4.01 (V4.01 H) Unit 1 Serial # 1895 Page 5 Sample: 1%-1% Operator: Siva Submitter: User File: C:62020\DATA\000-872. SMP Started: 29/12/2016 11:49:29AM Completed: 29/12/2016 4:31:26PM Report Time: 25/1/2017 1:00:35PM Sample Mass: 0.4722 9 Cold Free Space: 84.7623 cm Ambient Temperature: 22.00 C Automatic Degas: Yes Analysis Adsorptive: N2 Analysis Bath Temp.: -195,817 "C Thermal Correction: No Warm Free Space: 27 5743 cm Measured Equilibration Interval: 10 s Low Pressure Dose: None BET Surface Area Plot 1% -1% 0.025 0.020 0.015 1/10(Po/P-1)] 0.010 0.005 0.000 0.00 0.01 0.02 0.03 0.04 0.05 0.06 Relative Pressure (P/Po) 0.07 0.08 Legend V1 to V6 are the six calibrated bulbs in GB at temperature TB. V7 is the volume contained within X (upper calibration mark in GB), T14, T16, PT and with T15 open. This volume is at room temperature TR. VD is the Dead-space volume in S at liquid nitrogen temperature TN. a) Dead-space volume calculation. Let Ve the volume of the bulbs used in GB Let PL = the pressure recorded at any of the 5 dead-space volume measurements Since the number of He during the measurements is constant Rnye Vp TN (4) PL Thus, a plot of 1 PL versus (9) will be a straight line. V, The gradient = RnHe and the intercept = ) RnHe b) Calculation for volume of N2 adsorbed at STP per gram of adsorbent: Let VB = the volume of the bulbs used in GB P = pressure of gas in VB - V7 before contact with the sample (that is before opening tap T16) P = current equilibrium pressure that is after opening tap T16) P. = Equilibrium pressure from the previous adsorption measurement. The number of moles of gas adsorbed by the sample, n, for each adsorption measurement is then given by Rn (P.-P)VB. (P.-P)V, (P-P.)V TR TN TR (5) If the weight of the sample is w, then the volume adsorbed in cm3 at STP is given by V NRT, w where To = 273.2 K, and R = 82.05 cm atm k! Experiment 3 Determination of Surface Areas of Powders by Physical Adsorption of Gases Introduction Specific surface area or the surface area per gram of a powdered material is a frequently used parameter for characterisation of the sample. A number of methods are available for measuring specific surface areas but the method based on physical adsorption of gases is most popular. The adsorption of a gas by a solid can be brought about by chemical or physical forces. In physical adsorption of a gas by a solid, the forces involved are similar to van der Waals forces which cause condensation of a vapour to a liquid state. The amount of gas adsorbed per gram of a solid depends on the pressure and temperature and can be represented as: V = f (PT) where v is the amount of gas adsorbed per gram of solid of adsorbent (usually expressed as volume of gas in cm at STP), P is the equilibrium pressure of the gas or vapour, and T is the temperature At a fixed temperature, v = f(P) or v = f(P/P.) (1) where Po is the saturation vapour pressure of the gas. Equation (1) which relates the amount of gas adsorbed as a function of equilibrium gas pressure or relative pressure, PIP, is called an adsorption isotherm. In the Brunauer, Emmett and Teller (BET) classification the majority of isotherms which have been measured can be grouped into 5 types. In general, the first three types are characteristic of nonporous solids whereas the last two types, which possess hysteresis loops, are the characteristic of porous solids. 2 Type 1 Type IT Type IV Type + (2) Brunauer, Emmett and Teller were the first to propose a theory to explain the shapes of the isotherms. The BET theory is most reliable at low relative pressures. The BET equation is usually expressed in the following form (C-1) P V(Po-P) where Vm is the monolayer capacity and is equal to the volume of gas at STP (standard temperature and pressure: T = 273.2 K and P=1 atm) required to cover the entire surface with a complete monolayer, and C is a constant which depends on temperature. The constant is related to the heat of adsorption of the first layer, AH, by the expression: (3) . x. - . RT where AH is the heat of liquefaction of the gas. A plot of v(Po-P) versus P/P., if linear, gives the values of Vm and c. The linear range is usually observed between P/P, values of 0.05 and 0.35. If the cross-sectional area Am. (in A2) of the adsorbing gas molecules is known, the specific surface area, S, can be calculated from the equation: S = nm L.Am 10-20 mg where nm is the monolayer capacity expressed in moles of gas per gram of adsorbent and L is the Avogadro constant 15 ASAP 2020 V4.01 (V4.01 H) Unit 1 Serial # 1895 Page 1 Sample: 1%-1% Operator: Siva Submitter. User File:C:2020\DATA\000-872. SMP Started: 29/12/2016 11:49:29AM Completed: 20/12/2016 4:31:26PM Report Time: 25/1/2017 1:00:35PM Sample Mass: 0.4722 g Cold Free Space: 84.7623 cm Ambient Temperature: 22.00 "C Automatic Degas: Yes Analysis Adsorptive: N2 Analysis Bath Temp.: -195.817C Thermal Correction: No Warm Free Space: 27.5743 cm Measured Equilibration Interval: 10 s Low Pressure Dose: None Relative Pressure (P/Po) 0.010161657 0.033029249 0.067537343 0.080021001 0.100095999 0.120188439 0.140174695 0.160290674 0.180276736 0.2004 10713 0.250048917 0.300902553 0.350409334 0.400509097 0.450558746 0.500647577 0.550621171 0.600772006 0.650728594 0.700904409 0.740934284 0.771023528 0.801117288 0.821185996 0.841263620 0.861214395 0.876390919 0.891455542 0.906418123 0.916576103 0.926706770 0.934605230 0.941778370 0.948700230 0.954835269 0.960864733 0.965833623 0.969973143 0.972994006 0.976175091 0.979051157 0.982142555 0.984095441 0.986312790 ORA 179020 Isotherm Tabular Report Absolute Quantity Elapsed Time Saturation Pressure Adsorbed (h:min) Pressure (mmHg) (cm/g STP) (mmHg) 01:14 759 224915 7.712434 2.8506 01:31 25.066881 3.3278 01:34 51.253113 3.7631 01:37 60.724419 3.8898 01:39 75.955498 4.0793 01:41 91.196854 4.2543 01:44 106.357933 4.4207 01:46 121.616257 4.5808 01:48 136.774826 4.7288 01:50 152.044434 4.8732 01:52 189.692093 5.1985 01:55 228.261795 5.5025 01:57 265.806824 5.7719 01:59 303.792816 6.0321 02:02 341.743011 6.2756 02:04 379.719971 6.5059 02:06 417.598450 6.7383 02:09 455.615784 6.9734 02:11 493.482849 7.2201 02:13 531.502869 7.4814 02:16 561.836060 7.7210 02:18 584.629395 7.9275 02:20 607.424377 8.1592 02:22 622.604553 8.3375 02:25 637.802124 8.5366 02:27 652.902344 8.7663 02:29 664.382080 8.9724 02:31 675.762939 9.2093 02:34 687.078491 9.4863 02:36 694.751343 9.7230 02:38 702.402893 9.9848 02:40 708,348206 10.2326 02:43 713.757019 10.4881 02:45 718.974976 10.7795 02:47 723.596252 11.0822 02:49 728.122986 11.4285 02:52 731.859802 11.7849 02:54 734.967896 12.1493 02:56 737.228149 12.4720 02:58 . 739.595215 12.8293 03:01 741.745361 13.2045 03:03 744.058472 13.6689 03:05 745.508911 14.0564 03:07 747.145020 14.5626 03:10 74A A74027 16 OKA2 ) ASAP 2020 V4.01 (V4.01 H) Unit 1 Serial # 1895 Page 2 Sample: 1%-1% Operator: Siva Submitter: User File: C:\2020 DATA1000-872.SMP Started: 29/12/2016 11:49:29AM Completed: 29/12/2016 4:31:26PM Report Time: 25/1/2017 1:00:35PM Sample Mass: 0.4722 g Cold Free Space: 84.7623 cm Ambient Temperature: 22.00 C Automatic Degas: Yes Analysis Adsorptive: N2 Analysis Bath Temp.: -195.817 C Thermal Correction: No Warm Free Space: 27.5743 cm Measured Equilibration Interval: 10 s Low Pressure Dose: None Relative Pressure (P/Po) Saturation Pressure (mmHg) 0.990078113 757 409973 0.991461234 0.976419498 0.961714280 0.944747069 0.924406529 0.898720205 0.872901561 0.860792439 0.840062517 0.820216441 0.800150370 0.770069556 0.740087136 0.700131392 0.649700691 0.600148798 0.549891393 0.499880695 0.451462983 0.399194321 0.350494041 0.300347458 0.250125389 0.199985757 0.140170298 Isotherm Tabular Report Absolute Quantity Elapsed Time Pressure Adsorbed (h:min) (mmHg) (cm/g STP) 749.924255 15.6406 03:15 03:17 750.942627 16.257 03:19 739.549866 14.5255 03:24 728.411987 12.7461 03:28 715.560852 11.5133 03:32 700.154724 10.6446 03:35 680.699646 9.9482 03:38 661.144348 9.4773 03:40 651.972778 9.2886 03:43 636.271729 9.0404 03:45 621.240112 8.8383 03:47 606.041870 8.6616 03:49 583.258362 8.4341 03:52 560.549377 8.2421 03:54 530.286499 8.0135 03:56 492.089783 7.7582 03:59 454.558685 7.5288 04:01 416.493225 7.3058 04:03 378.614624 7.0797 04:06 341.942566 6.4154 04:09 302.353760 5.9752 04:12 265.467682 5.6780 04:14 227.486160 5.3844 04:17 189.447464 5.0675 04:21 151.471207 4.7423 04:24 106.166382 4.3174 04:27 ASAP 2020 V4.01 (V4.01 H) Unit 1 Serial # 1895 Page 3 Sample: 1%-1% Operator Siva Submitter: User File: C:620201DATA\000-872. SMP Started: 29/12/2016 11:49:29AM Completed: 29/12/2016 4:31:26PM Report Time: 26/1/2017 1:00:35PM Sample Mass: 0.4722 9 Cold Free Space: 14.7623 cm Ambient Temperature: 22.00 C Automatic Degas: Yes Analysis Adsorptive: N2 Analysis Bath Temp: -195.817 "C Thermal Correction: No Warm Free Space: 27 5743 cm Measured Equilibration Interval 105 Low Pressure Dose: None Isotherm Linear Plot 1% 1%. Adsorption 1%-1% - Desorption 10 14 12 10 Quantity Adsorbed (cm'lg STP) 2 0 0.0 0.1 02 0.3 0.7 0.8 0.4 0.5 0.6 Relative Pressure (P/Po) 09 1.0 ASAP 2020 V4.01 (V4.01 H) Unit 1 Serial #: 1895 Page 4 Sample: 1%-1% Operator: Siva Submitter: User File: C:\2020\DATA\000-872.SMP Started: 29/12/2016 11:49:29AM Completed: 29/12/2016 4:31:26PM Report Time: 25/1/2017 1:00:35PM Sample Mass: 0.4722 9 Cold Free Space: 84.7623 cm Ambient Temperature: 22.00 C Automatic Degas: Yes Analysis Adsorptive: N2 Analysis Bath Temp.: -195.817 "C Thermal Correction: No Warm Free Space: 27.5743 cm. Measured Equilibration Interval: 10 s Low Pressure Dose: None BET Surface Area Report BET Surface Area: 16.4973 +0.3009 mig Slope: 0.262600 0.004803 g/cm STP Y-Intercept: 0.001273 : 0.000320 g/cm' STP C: 207.285996 Qm: 3.7897 cm g STP Correlation coefficient: 0.9994986 Molecular Cross-Sectional Area: 0.1620 nm Relative Quantity 1/[Q(Po/P-1)] Pressure Adsorbed (P/Po) (cmg STP) 0.010161657 2.8506 0.003601 0.033029249 3.3278 0.010264 0.067537343 3.7631 0.019247 0.080021001 3.8898 0.022361 0.100095999 4.0793 0.027267 ASAP 2020 V4.01 (V4.01 H) Unit 1 Serial # 1895 Page 5 Sample: 1%-1% Operator: Siva Submitter: User File: C:62020\DATA\000-872. SMP Started: 29/12/2016 11:49:29AM Completed: 29/12/2016 4:31:26PM Report Time: 25/1/2017 1:00:35PM Sample Mass: 0.4722 9 Cold Free Space: 84.7623 cm Ambient Temperature: 22.00 C Automatic Degas: Yes Analysis Adsorptive: N2 Analysis Bath Temp.: -195,817 "C Thermal Correction: No Warm Free Space: 27 5743 cm Measured Equilibration Interval: 10 s Low Pressure Dose: None BET Surface Area Plot 1% -1% 0.025 0.020 0.015 1/10(Po/P-1)] 0.010 0.005 0.000 0.00 0.01 0.02 0.03 0.04 0.05 0.06 Relative Pressure (P/Po) 0.07 0.08Step by Step Solution
There are 3 Steps involved in it
Step: 1

Get Instant Access to Expert-Tailored Solutions
See step-by-step solutions with expert insights and AI powered tools for academic success
Step: 2

Step: 3
Ace Your Homework with AI
Get the answers you need in no time with our AI-driven, step-by-step assistance
Get Started
Industrial Plastics Theory And Applications
Authors: Erik Lokensgard
6th Edition
1285061233, 978-1285061238