

Question: Cautions about correlation A data set was graphed using a scatterplot 30 25 20 15 10 5 0 5 10 15 20 25 30 The
Cautions about correlation
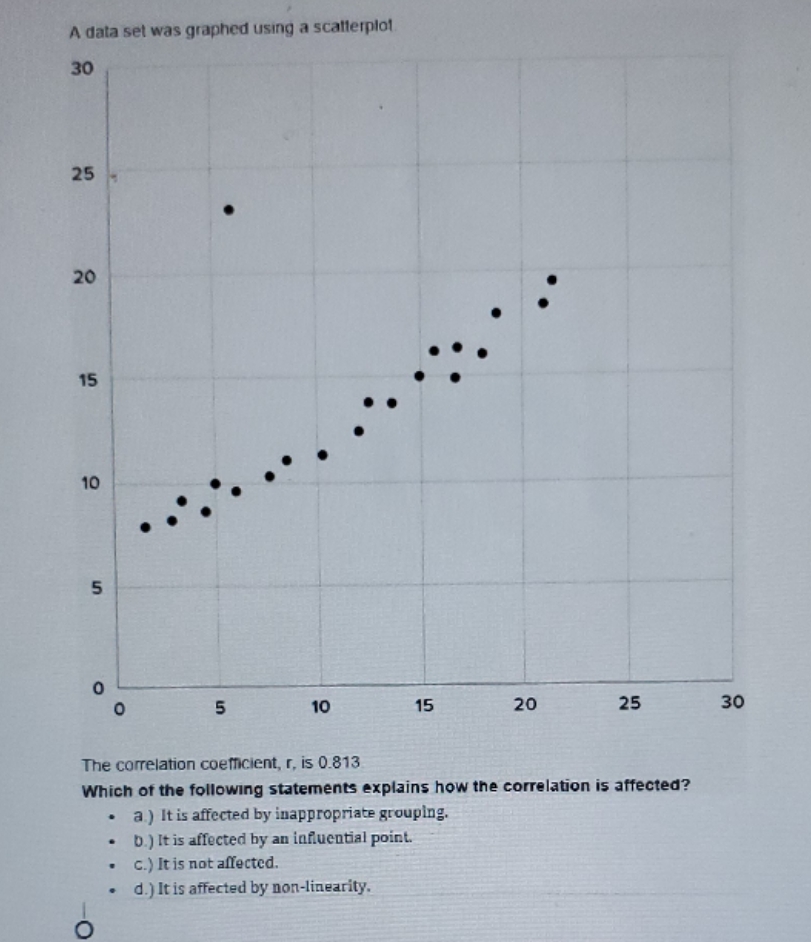
A data set was graphed using a scatterplot 30 25 20 15 10 5 0 5 10 15 20 25 30 The correlation coefficient, r, is 0.813 Which of the following statements explains how the correlation is affected? . a.) It is affected by inappropriate grouping. D.) It is affected by an influential point. . C.) It is not affected. d.) It is affected by non-linearity. O
Step by Step Solution
There are 3 Steps involved in it
1 Expert Approved Answer
Step: 1 Unlock

Question Has Been Solved by an Expert!
Get step-by-step solutions from verified subject matter experts
Step: 2 Unlock
Step: 3 Unlock