

Answered step by step
Verified Expert Solution
Question
1 Approved Answer
clear clc disp('Problem 3: your name) t= ; r= ; theta= ; dr= 0; dt= dr2=diff(X,2)dtheta plot(v,t), title('Problem 3: quiz1') xlabel('t'), ylabel('Z(t)') Problem 3 A
clear
clc
disp('Problem 3: your name)
t= ;
r= ;
theta= ;
dr= 0;
dt=
dr2=diff(X,2)dtheta
plot(v,t),
title('Problem 3: quiz1')
xlabel('t'),
ylabel('Z(t)')
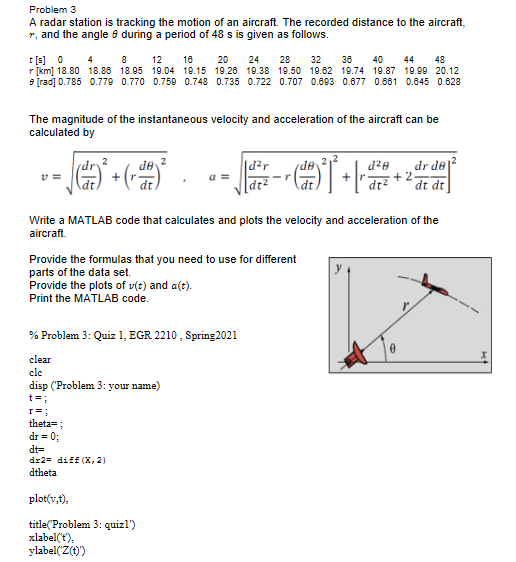
Problem 3 A radar station is tracking the motion of an aircraft. The recorded distance to the aircraft, r, and the angle 8 during a period of 48 s is given as follows. [s] 0 4 8 12 18 20 24 28 32 38 40 44 48 km] 18.80 18.86 18.95 19.04 19.15 19.26 19.38 19.50 19.62 19.74 19.87 19.99 20.12 Trad] 0.785 0.779 0.770 0.750 0.748 0.735 0.722 0.707 0.893 0.877 0.681 0.845 0.628 The magnitude of the instantaneous velocity and acceleration of the aircraft can be calculated by dar de Johann Georg a - [atz d2e dr de + 2 dt dt dt Write a MATLAB code that calculates and plots the velocity and acceleration of the aircraft Provide the formulas that you need to use for different parts of the data set. Provide the plots of v(t) and a(t). Print the MATLAB code. % Problem 3: Quiz 1, EGR 2210, Spring 2021 clear clc disp('Problem 3: your name) t= r=; theta=; dr = 0; dt= dr2= diff(X, 2) dtheta plot(v.t). title('Problem 3: quizl') xlabel(t), ylabel("Z(t)) Problem 3 A radar station is tracking the motion of an aircraft. The recorded distance to the aircraft, r, and the angle 8 during a period of 48 s is given as follows. [s] 0 4 8 12 18 20 24 28 32 38 40 44 48 km] 18.80 18.86 18.95 19.04 19.15 19.26 19.38 19.50 19.62 19.74 19.87 19.99 20.12 Trad] 0.785 0.779 0.770 0.750 0.748 0.735 0.722 0.707 0.893 0.877 0.681 0.845 0.628 The magnitude of the instantaneous velocity and acceleration of the aircraft can be calculated by dar de Johann Georg a - [atz d2e dr de + 2 dt dt dt Write a MATLAB code that calculates and plots the velocity and acceleration of the aircraft Provide the formulas that you need to use for different parts of the data set. Provide the plots of v(t) and a(t). Print the MATLAB code. % Problem 3: Quiz 1, EGR 2210, Spring 2021 clear clc disp('Problem 3: your name) t= r=; theta=; dr = 0; dt= dr2= diff(X, 2) dtheta plot(v.t). title('Problem 3: quizl') xlabel(t), ylabel("Z(t))Step by Step Solution
There are 3 Steps involved in it
Step: 1

Get Instant Access to Expert-Tailored Solutions
See step-by-step solutions with expert insights and AI powered tools for academic success
Step: 2

Step: 3
Ace Your Homework with AI
Get the answers you need in no time with our AI-driven, step-by-step assistance
Get Started
Learning PostgreSQL
Authors: Salahaldin Juba, Achim Vannahme, Andrey Volkov
1st Edition
178398919X, 9781783989195