

Answered step by step
Verified Expert Solution
Question
1 Approved Answer
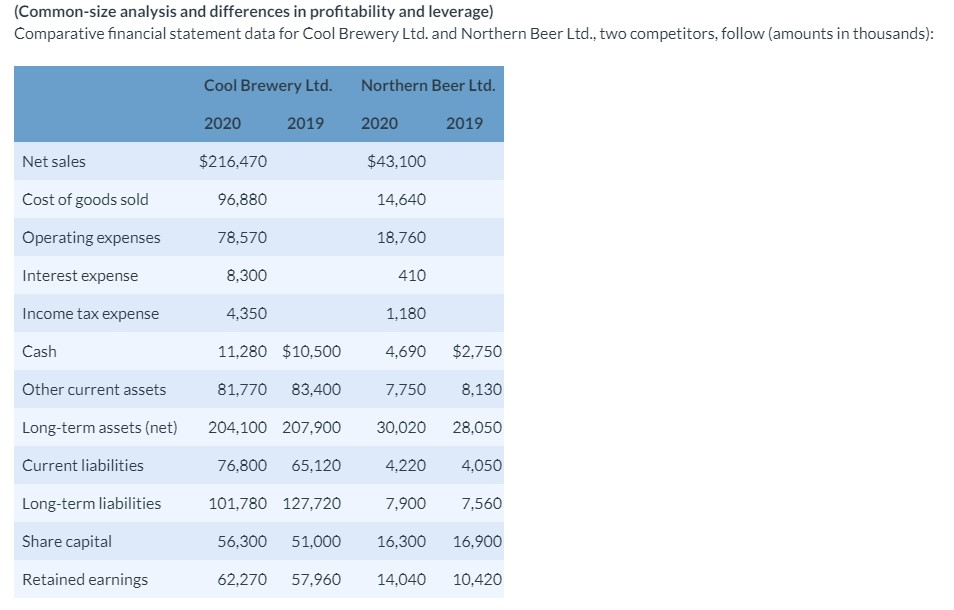
(Common-size analysis and differences in profitability and leverage) Comparative financial statement data for Cool Brewery Ltd. and Northern Beer Ltd., two competitors, follow (amounts in
Step by Step Solution
There are 3 Steps involved in it
Step: 1

Get Instant Access to Expert-Tailored Solutions
See step-by-step solutions with expert insights and AI powered tools for academic success
Step: 2

Step: 3
Ace Your Homework with AI
Get the answers you need in no time with our AI-driven, step-by-step assistance
Get Started
Computers In Medical Audit A Guide Commissioned By The West Midlands Regional Health Authority
Authors: R. Tyndall, Michael Rigby, Anne McBride, Chris Shiels
2nd Edition
1853151777, 978-1853151774