

Answered step by step
Verified Expert Solution
Question
1 Approved Answer
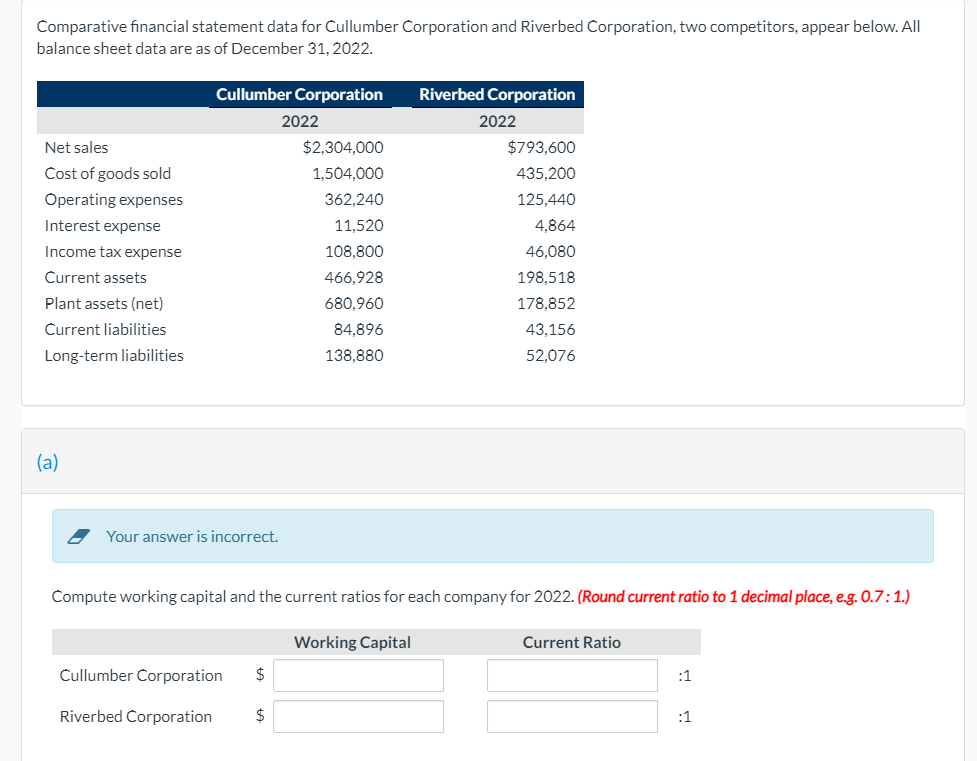
Comparative financial statement data for Cullumber Corporation and Riverbed Corporation, two competitors, appear below. All balance sheet data are as of December 31, 2022. Net
Step by Step Solution
There are 3 Steps involved in it
Step: 1

Get Instant Access to Expert-Tailored Solutions
See step-by-step solutions with expert insights and AI powered tools for academic success
Step: 2

Step: 3
Ace Your Homework with AI
Get the answers you need in no time with our AI-driven, step-by-step assistance
Get Started
Analysing Financial Performance Using Integrated Ratio Analysis
Authors: Nic La Rosa
1st Edition
0367552523, 978-0367552527