Answered step by step
Verified Expert Solution
Link Copied!

Question

1 Approved Answer

Comparative Income Statements: 2018 and 2019 Financial Statement Analysis Horizontal Analysis Percentage Dollar Change Change Vertical Analysis: 2019 2019 2018 Sales Cost of Sales Gross
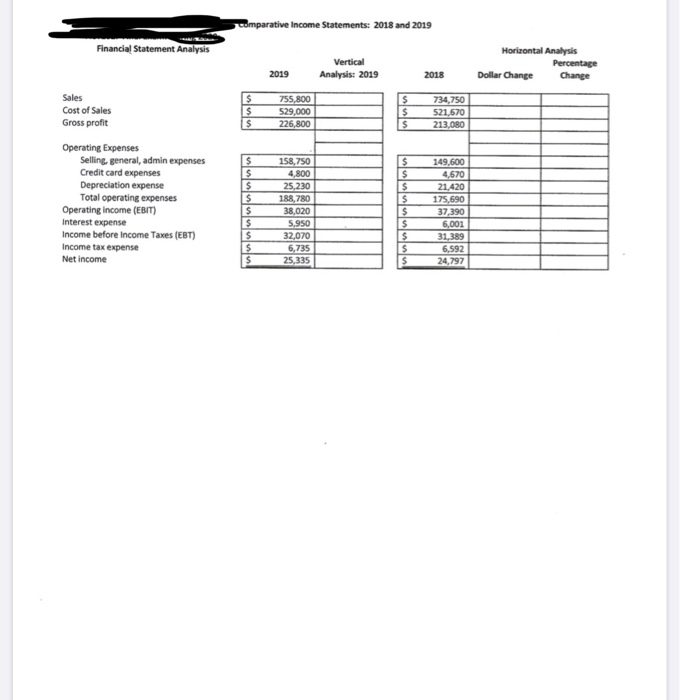
image text in transcribed
Comparative Income Statements: 2018 and 2019 Financial Statement Analysis Horizontal Analysis Percentage Dollar Change Change Vertical Analysis: 2019 2019 2018 Sales Cost of Sales Gross profit 755,800 529,000 226,800 734,750 521,670 213.00 149.500 4.520 21.420 Operating Expenses Selling general, admin expenses Credit card expenses Depreciation expense Total operating expenses Operating income (EBIT) Interest expense Income before Income Taxes (EBT) Income tax expense Net income 175.690 37,390 6,735 25,335 6.592 24,797

Step by Step Solution

There are 3 Steps involved in it

Step: 1

blur-text-image

Get Instant Access to Expert-Tailored Solutions

See step-by-step solutions with expert insights and AI powered tools for academic success

Step: 2

blur-text-image_2

Step: 3

blur-text-image_3

Ace Your Homework with AI

Get the answers you need in no time with our AI-driven, step-by-step assistance

Get Started

Recommended Textbook for

More Books

Students also viewed these Accounting questions

Question

2. The model is credible to the trainees.

Answered: 1 week ago