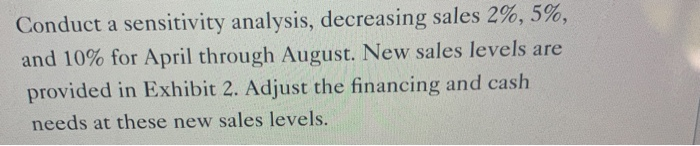
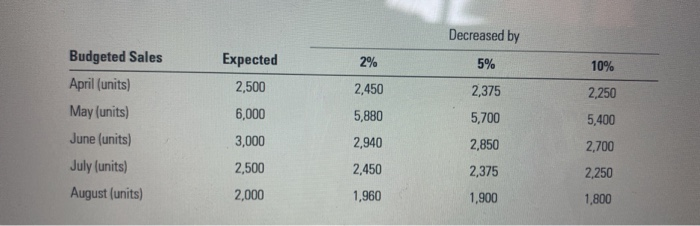
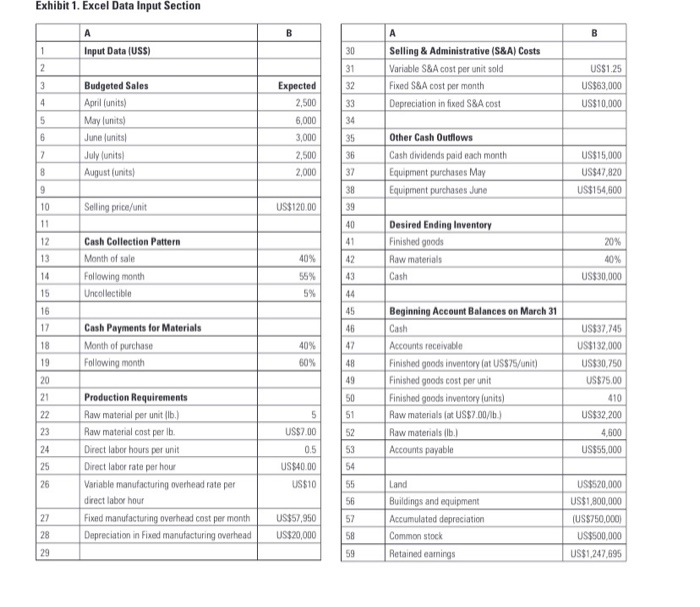
Conduct a sensitivity analysis, decreasing sales 2%, 5%, and 10% for April through August. New sales levels are provided in Exhibit 2. Adjust the financing and cash needs at these new sales levels. Decreased by 2% 5% 10% 2,250 Expected 2,500 6,000 3,000 2,500 2,450 5,880 Budgeted Sales April (units) May (units) June (units) July (units) August (units) 2,375 5,700 2,940 2,850 5,400 2,700 2.250 1,800 2,450 2,375 1,900 2,000 1,960 Exhibit 1. Excel Data Input Section Input Data (USS) 30 Selling & Administrative (S&A) Costs Variable S&A cost per unit sold Fixed S&A cost per month Depreciation in fixed S&A cost Expected US$1.25 US$63.000 US$10,000 2,500 6,000 Budgeted Sales April (units) May (units) June units) July units August (units) 3000 III 2.500 Other Cash Outflows Cash dividends paid each month Equipment purchases May Equipment purchases June 2.000 US$15,000 US$47.820 US$154,600 Selling price/unit US$120.00 sel 20% Desired Ending Inventory Finished goods Raw materials Cash Cash Collection Pattern Month of sale Following month Uncollectible 40% US$30,000 Cash Payments for Materials Month of purchase Following month Beginning Account Balances on March 31 Cash Accounts receivable Finished goods inventory at USS75/unit) Finished goods cost per unit Finished goods inventory (units) Raw materials at US$7.00/lb. Raw materials (lb) Accounts payable US$37,745 US$132,000 US$30,750 US$75.00 410 INNIN US$32 200 4,600 US$55,000 Production Requirements Raw material per unit b.) Raw material cost per lb. Direct labor hours per unit Direct labor rate per hour Variable manufacturing overhead rate per direct labor hour Fixed manufacturing overhead cost per month Depreciation in Fixed manufacturing overhead US$40.00 US$10 US$57,950 US$20,000 Land Buildings and equipment Accumulated depreciation Common stock Retained earnings US$520,000 US$1,800,000 (US$750,000 US$500,000 US$1,247,695 28 Conduct a sensitivity analysis, decreasing sales 2%, 5%, and 10% for April through August. New sales levels are provided in Exhibit 2. Adjust the financing and cash needs at these new sales levels. Decreased by 2% 5% 10% 2,250 Expected 2,500 6,000 3,000 2,500 2,450 5,880 Budgeted Sales April (units) May (units) June (units) July (units) August (units) 2,375 5,700 2,940 2,850 5,400 2,700 2.250 1,800 2,450 2,375 1,900 2,000 1,960 Exhibit 1. Excel Data Input Section Input Data (USS) 30 Selling & Administrative (S&A) Costs Variable S&A cost per unit sold Fixed S&A cost per month Depreciation in fixed S&A cost Expected US$1.25 US$63.000 US$10,000 2,500 6,000 Budgeted Sales April (units) May (units) June units) July units August (units) 3000 III 2.500 Other Cash Outflows Cash dividends paid each month Equipment purchases May Equipment purchases June 2.000 US$15,000 US$47.820 US$154,600 Selling price/unit US$120.00 sel 20% Desired Ending Inventory Finished goods Raw materials Cash Cash Collection Pattern Month of sale Following month Uncollectible 40% US$30,000 Cash Payments for Materials Month of purchase Following month Beginning Account Balances on March 31 Cash Accounts receivable Finished goods inventory at USS75/unit) Finished goods cost per unit Finished goods inventory (units) Raw materials at US$7.00/lb. Raw materials (lb) Accounts payable US$37,745 US$132,000 US$30,750 US$75.00 410 INNIN US$32 200 4,600 US$55,000 Production Requirements Raw material per unit b.) Raw material cost per lb. Direct labor hours per unit Direct labor rate per hour Variable manufacturing overhead rate per direct labor hour Fixed manufacturing overhead cost per month Depreciation in Fixed manufacturing overhead US$40.00 US$10 US$57,950 US$20,000 Land Buildings and equipment Accumulated depreciation Common stock Retained earnings US$520,000 US$1,800,000 (US$750,000 US$500,000 US$1,247,695 28