

Answered step by step
Verified Expert Solution
Question
1 Approved Answer
Data for Muscateer Desgin, Inc. follow: Requirement 1: Prepare a comparative common-size income statement for Muscateer Design, Inc. using the 2018 and 2017 data. Round
Data for Muscateer Desgin, Inc. follow: 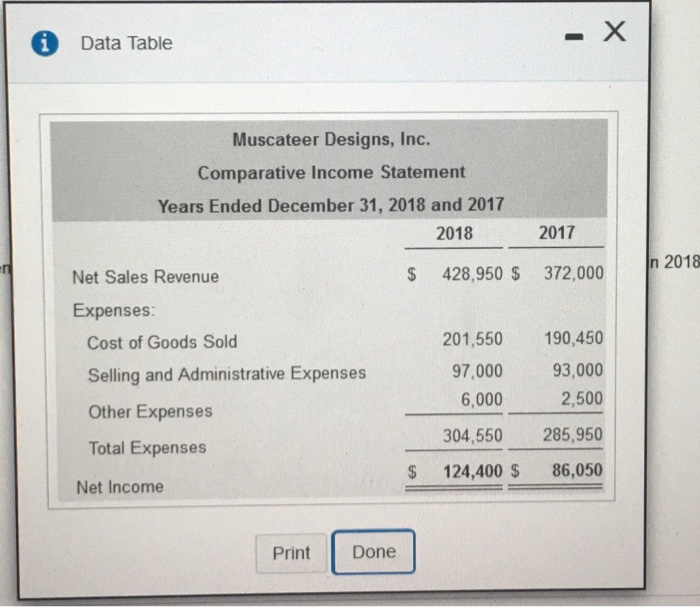
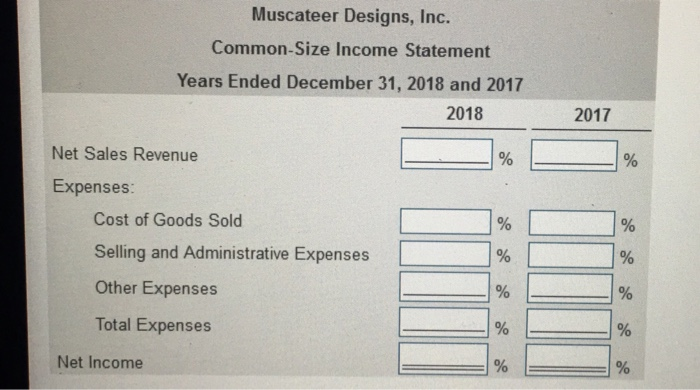
i Data Table Muscateer Designs, Inc. Comparative Income Statement Years Ended December 31, 2018 and 2017 2018 2017 n 2018 Net Sales Revenue $ 428,950 $ 372,000 Expenses Cost of Goods Sold Selling and Administrative Expenses Other Expenses Total Expenses 201,550 190,450 97,000 93,000 2,500 304,550 285,950 S 124,400 S 86,050 6,000 Net Income Print Done Muscateer Designs, Inc. Common-Size Income Statement Years Ended December 31, 2018 and 2017 2018 2017 Net Sales Revenue Expenses Cost of Goods Sold Selling and Administrative Expenses Other Expenses Total Expenses Net Income Requirement 1: Prepare a comparative common-size income statement for Muscateer Design, Inc. using the 2018 and 2017 data. Round percentages to one-tenth percent. ( Round the percentages to one-tenth precent, X.X%)
Requirement 2: To an investor, how does 2018 compare with 2017? Explain your reasoning
An investor would be _______(a. Pleased b. Disappointed) with 2018 in comparison with 2017. Cost of goods sold and selling and general expenses- the two largest expenses-consumed _______ (a. Smaller b. Higher) percentages of net revenue in 2018 and net income represents a _____ (a.higher b. Smaller) percentage of revenues. Overall profits are ______(a. Declining b. Rising)
Step by Step Solution
There are 3 Steps involved in it
Step: 1

Get Instant Access to Expert-Tailored Solutions
See step-by-step solutions with expert insights and AI powered tools for academic success
Step: 2

Step: 3
Ace Your Homework with AI
Get the answers you need in no time with our AI-driven, step-by-step assistance
Get Started
Accounting and auditing research tools and strategies
Authors: Thomas Weirich, Thomas Pearson, Natalie Tatiana
8th edition
9781118806487, 1118027078, 1118806484, 978-1118027073