Answered step by step
Verified Expert Solution
Question
1 Approved Answer
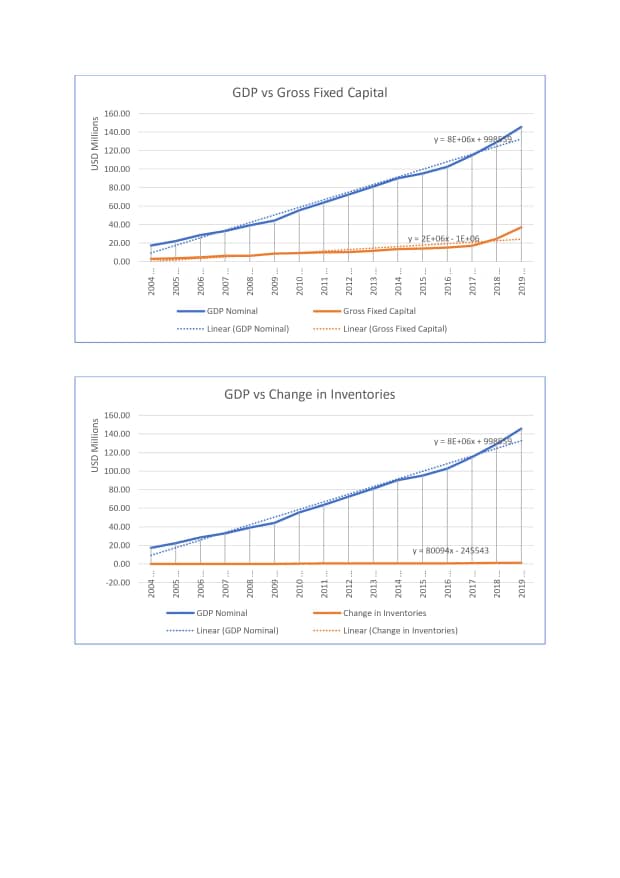
discuss the trends in the graph USD Millions USD Millions 100.00 -70.DD 120.00 140.00 160,D0 60.00 20,00 80.0D 40.DD 100.DD 140.00 120.00 160.00 80,OD 20.00
discuss the trends in the graph
 USD Millions USD Millions 100.00 -70.DD 120.00 140.00 160,D0 60.00 20,00 80.0D 40.DD 100.DD 140.00 120.00 160.00 80,OD 20.00 40.00 60.00 2004 2004 2005 2005 2005 2006 . #+Linear (GOP Nominal] GDP Nominal 2007 ... 2007 .. GOP Nominal awareness Linear [GDP Nominal) 2008. 2008.. 2009 2009 2010 .. 2010 .. GDP vs Change in Inventories GDP v5 Gross Fixed Capital 2011 -4+ 2011 . 2012 2017 . 2019 - Gross Fixed Capital 2013 .. Treeees" Linear (Gross Fixed Capital) +4+ Linear (Change in Inventories) Change in Inventories 2014 2014 . 2015 - 2015. 2016 ... V BOO94x - 245543 2016 2017 Y = BE+D6x + 9985 4 2017 .. Y = BE+06x + 99AP 7018 2018. 2019 2019
 Step by Step Solution
There are 3 Steps involved in it
Step: 1

Get Instant Access to Expert-Tailored Solutions
See step-by-step solutions with expert insights and AI powered tools for academic success
Step: 2

Step: 3

Ace Your Homework with AI
Get the answers you need in no time with our AI-driven, step-by-step assistance
Get Started


