Question
Evaluate the financial performance of Coca-Cola; ( KO ) and Pepsi ( PEP ) for the year ended December 31, 2018. Follow the instructions below
Evaluate the financial performance of Coca-Cola; (KO) and Pepsi (PEP) for the year ended December 31, 2018. Follow the instructions below to access each companys information and perform a financial analysis based on the financial measures we have learned in this course. Go to yahoo.com/ and then select Finance. In the Search section at the top of the screen select KO for Coca-Cola and PEP for Pepsi. Select Financials and select Income Statement when accessing the Income Statement. Select Financials and select Balance Sheet when accessing the Balance Sheet
- Do the following for KO and PEP for the year ended 12/31/18 only: Perform a vertical analysis of the Income Statement for KO and PEP for the year ended 12/31/18. Include in your vertical analysis all of following as a % of total revenue:
- Cost of Revenue as a % of Total Revenue
- Gross Profit as a % of Total Revenue
- Selling, gen and administrative expenses as a % of Total Revenue
- Operating Income as a % of Total Revenue
- Net Income as a % of Total Revenue
- Current Ratio
- Accounts Receivable turnover. Assume the total revenue on the income statement represents all sales on account for the year
- Average collection period
- Merchandise Inventory turnover. Assume the Cost of Revenue on the Income Statement is the same as the Cost of Goods Sold
- Debt to Asset Ratio
- Return on Assets Ratio
- Asset Turnover
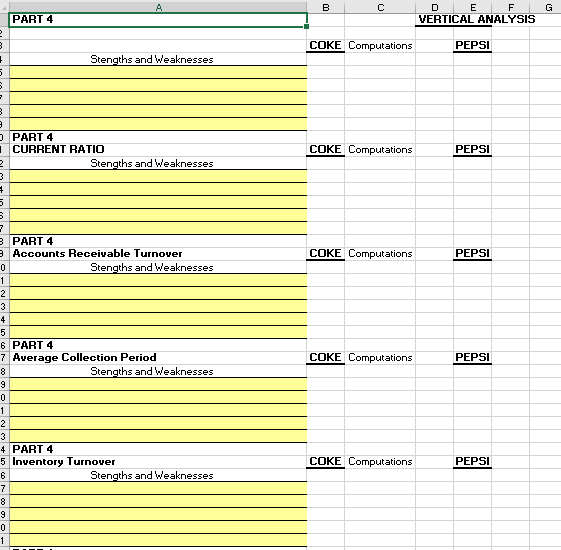
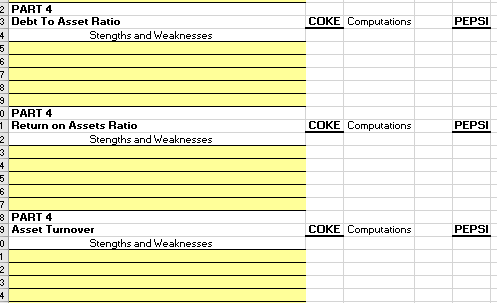
In preparing the vertical analysis and other financial analysis above; define each measure and identify the strengths and weaknesses of KO and PEP as related to each other. Below is an example of you should set it up.
| Working Capital | KO | PEP |
| Current Assets | $ 30,634,000 | $ 21,893,000 |
| - Current Liabilities | $ 29,223,000 | $ 22,138,000 |
| Net Working Capital = | $ 1,411,000 | $ (245,000) |
Strength or Weakness
Working Capital measures the ability of a company to meet its short-term obligations with current assets. Coke is performing a little better since they have a positive net working capital contrasted with Pepsis negative working capital.


PART 4 VERTICAL ANALYSIS COKE Computations PEPSI Stengths and Weaknesses PART 4 CURRENT RATIO COKE Computations PEPSI Stengths and Weaknesses PART 4 Accounts Receivable Turnover COKE Computations PEPSI Stengths and Weaknesses 6 PART 4 7Average Collection Period COKE Computations PEPSI Stengths and Weaknesses 4 PART 4 5 Inventory Turnover COKE Computations PEPSI Stengths and Weaknesses 3 PART 4 Debt To Asset Ratio COKE Computa ations PEPSI Stengths and Weaknesses 0 PART 4 COKE Computations PEPS Return on Assets Ratio Stengths and Weaknesses 8 PART 4 Asset Turnover COKE Computations PEPSI Stengths and Weaknesses
Step by Step Solution
There are 3 Steps involved in it
Step: 1

Get Instant Access to Expert-Tailored Solutions
See step-by-step solutions with expert insights and AI powered tools for academic success
Step: 2

Step: 3

Ace Your Homework with AI
Get the answers you need in no time with our AI-driven, step-by-step assistance
Get Started


