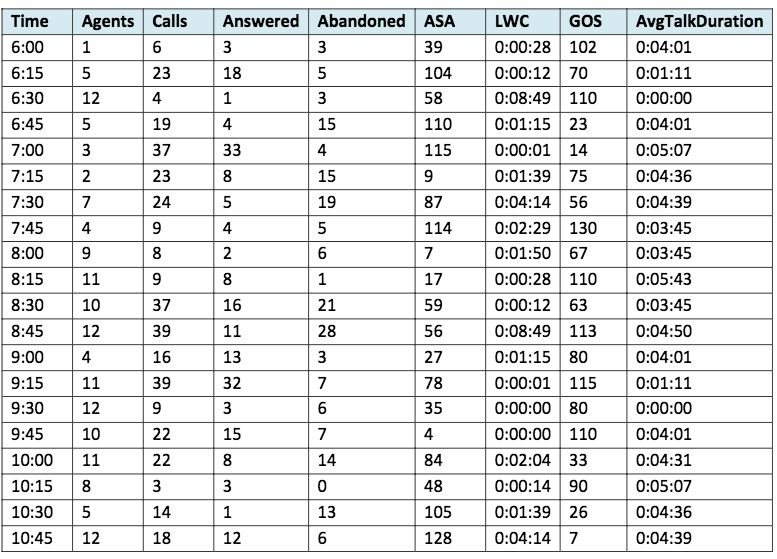
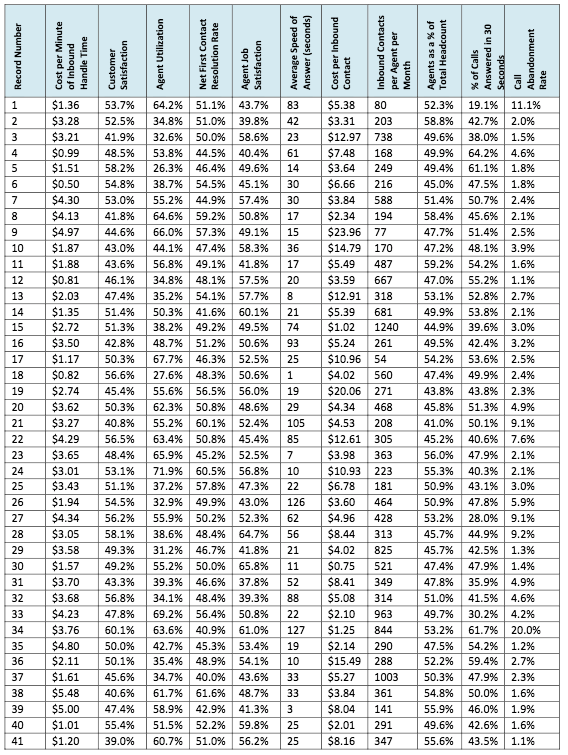
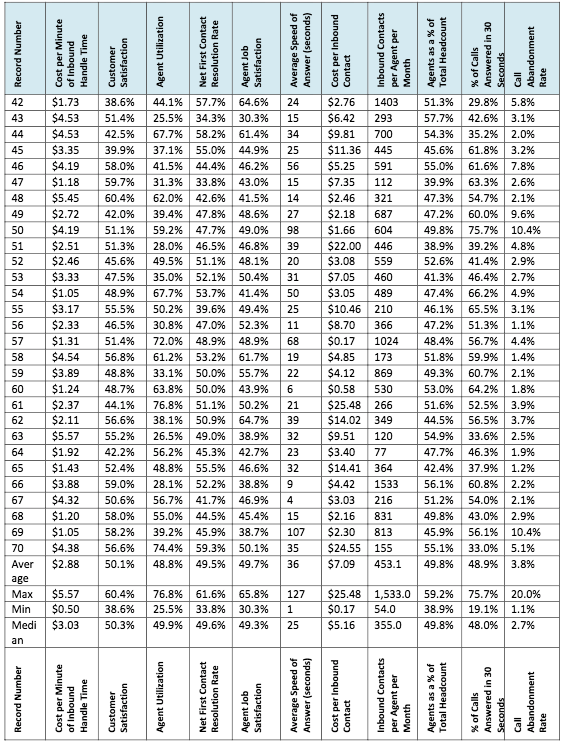
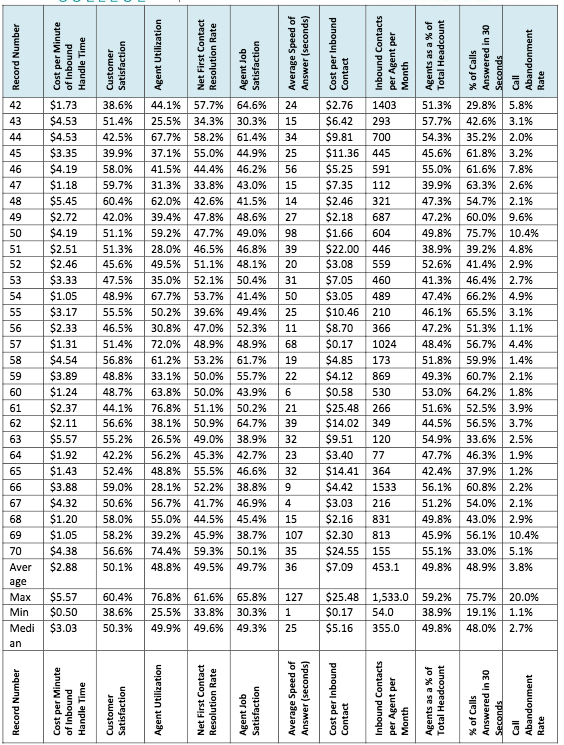
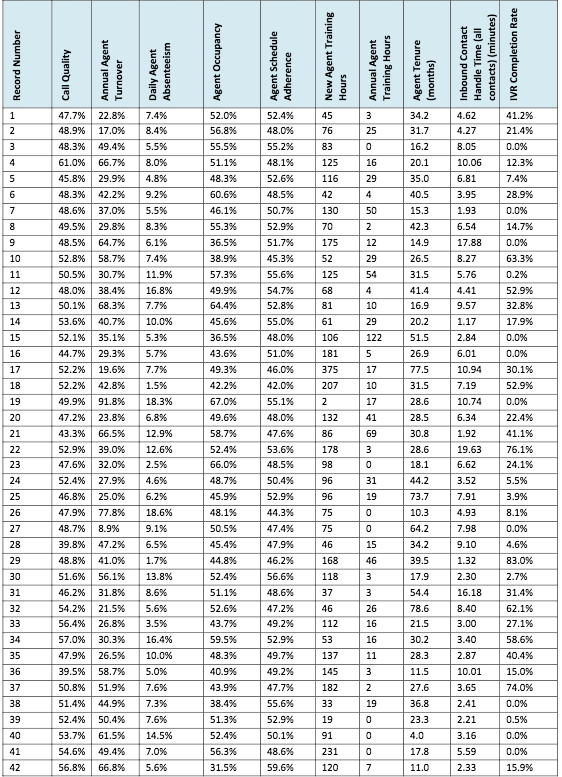
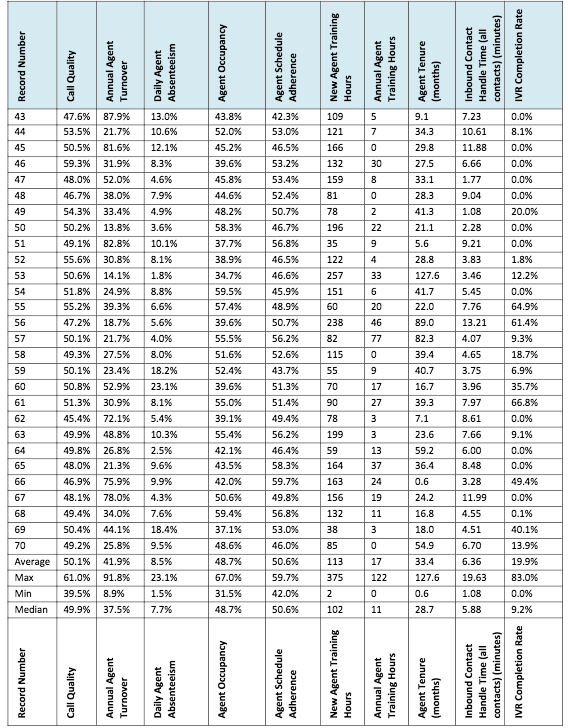
\f\fSatisfaction Resolution Rate Satisfaction Average Speed of Answer (seconds) Cost per Inbound Agents as a % of Total Headcount Answered In 30 $1.73 38.6% 64.6% 24 $2.76 1403 51.3% 29.8% 5.8% $4.53 51.4% 25.5% 34.3%% 30.3% 15 $6.42 57.7% 42.6% 3.1% $4.53 42.5% 61.4% 34 54.3%% 35.2% 2.0% $3.35 55.0% 44.9% 25 $11.36 3.2% 46 $4.19 58.0% 41.5% 44.4% 46.2% 56 $5.25 591 61.6% $1.18 59.7% 31.3%% 33.8% 15 $7.35 112 39.9% 63.3% 2.6% $5.45 60.4% 62.0% 42.6% $2.46 321 2.1% 49 42.0%% 39.4% 47.8% 48.6% 27 $2.18 687 9.6% 50 59.2% 47.7% 98 $1.66 604 49.8% 75.7% 51 $2.51 51.3% 39 $22.00 446 4.8% 52 $2.46 45.6% 20 $3.08 559 52.6% 41.4% 2.9% 53 47.5% 31 $7.05 41.3 54 $1.05 48.9% 67.7% 53.7% 41.4% 50 $3.05 489 47.4% 66.2% 4.9% 55 $3.17 55.5% 39.6%% 25 $10.46 65.5% 3.1% 56 30.8% 47.0% 52.3% 11 $8.70 51.3% 1.1% $1.31 51.4% 72.0% 48.9% 68 $0.17 1024 48.4% 56.7% 4.4% 58 $4.54 56.8% 61.2% 53.2% 19 173 51.8% 1.4% 33.1% 50.0% 55.7% 22 49.3% 60.7% 2.1% 48.7% 50.0% 43.9% $0.58 530 64.2% 1.8% 61 $2.37 44.1% 76.8% 21 $25.48 51.6% 3.9% 62 $2.11 56.6% 39 $14.02 349 44.5% 63 $5.57 55.2%% 26.5% 49.0% 38.9% 32 120 54.9% 33.6% 2.5% 64 $1.92 42.2% 56.2% 45.3% 23 $3.40 77 47.7% 46.3% 1.9% $1.43 52.4% 48.8% 46.6% 32 $14.41 364 42.4% 37.9% 1.2% 66 $3.88 59.0% 52.2% 38.8% $4.42 60.8% 2.2% $4.32 50.6% 56.7% 46.9% $3.03 51.2% 54.0% $1.20 58.0% 55.0% 45.4% 15 $2.16 831 49.8% 59 $1.05 58.2% 39.2% 45.9% 107 $2.30 813 45.9% 56.1% 70 $4.38 56.6% 74.4% 59.3% 50.1% 35 $24.55 155 55.1% 33.0% 5.1% $2.88 50.1% 48.8% 49.7% 36 48.9% 3.8% age $5.57 60.4% 61.6% 127 $25.48 1,533.0 59.2% Min $0.50 38.6% 25.5% 33.8% 54.0 38.9% $3.03 50.3% 49.9% 49.6% 49.3%% 25 $5.16 49.8% 48.0% 2.7% of Inbound Customer Resolution Rate Satisfaction Average Speed of Answer (seconds] Agents as a % of Answered In 30 AbandonmentRecord Number Cost per Minute Net First Contact Satisfaction Average Speed of per Agent per Call 38.6% 24 1403 51.3% 29.8% 5.8% $4.53 51.4%% 34.3% 30.3% 15 $6.42 293 57.7% 42.6% 3.1 44 $4.53 42.5% 34 $9.81 700 54.3% 2.0% 39.9% 37.1% 55.0% 44.9% 25 $11.36 445 45.6% 61.8% 3.2% 46 $4.19 44.4% 46.2% 56 591 61.6% 7.8% 47 $1.18 59.7% 31.3% 43.0% 15 $7.35 39.9% 63.3% $5.45 60.4% 62.0% 42.6% 14 $2.46 321 47.3% 54.7% 2.1% 49 $2.72 42.0% 47.8% 48.6% 687 47.2% 60.0% 9.6% 50 $4.19 51.1% 98 $1.66 604 49.8% 10.4% 51 $2.51 51.3% 28.0% 39 $22.00 446 38.9% 39.2% 52 45.6% 49.5% 51.1% 20 52.6% 41.4% 2.9% 53 $3.33 47.5% 35.0% 52.1% 50.4% 31 $7.05 2.7% 54 $1.05 48.9% 67.7% 50 $3.05 489 47.4% 66.2% 4.9% 39.6% $10.46 210 3.1% 56 $2.33 46.5% 30.8% 47.0% 52.3% $8.70 47.2% 1.1% 57 $1.31 72.0% 48.9% 68 1024 48.4% 56.7% 4.4% $4.54 61.2% 53.2% 19 $4.85 173 51.8% 59.9% 59 $3.89 48.8% 33.1% 50.0% 55.7% 22 $4.12 369 60.7% 2.19 60 $1.24 50.0% $0.58 530 53.0% 64.2% 1.8% $2.37 44.1% 50.2% 21 $25.48 51.6% 52.5% 3.9% 62 $2.11 56.6%% 38.1% 50.9% 39 $14.02 349 44.5% 56.5% 3.7% 63 $5.57 55.2% 49.0% 38.9%% 32 $9.51 120 54.9% 2.5% 64 45.3% 23 $3.40 77 47.7% 46.3% 1.9% 65 $1.43 55.5% 32 $14.41 364 42.4% 37.9% 1.2% 66 $3.88 28.1% 52.2% 38.8% $4.42 1533 56.1% 60.8% 2.2% 67 $4.32 50.6% 41.7% 46.9% 216 51.2% 54.0% 2.1% $1.20 15 49.8% 43.0% 2.9% 69 58.2%% 45.9% 38.7% 107 $2.30 313 45.9% 10.4% 70 $4.38 74.4% 59.3% 50.1% 35 $24.55 155 55.1% $2.88 50.1% 48.8% 36 453.1 49.8% 48.9% 3.8% 76.8% 61.6% 65.8% 127 $25.48 1,533.0 75.7% $0.50 38.6% 33.8%% 30.3% $0.17 54.0 38.9% 19.1% 1.1% Medi $3.03 49.9% 25 $5.16 48.0% 2.7% Cost per Minute Customer Net First Contact Resolution Rate Agent Job Satisfaction Average Speed of Cost per Inbound per Agent per Total Headcount AbandonmentCall Quality Annual Agent Daily Agent Agent Schedule Adherence New Agent Training Hours Annual Agent Training Hours Agent Tenure (months] Handle Time (all contacts) (minutes] IVR Completion Rate 47.7% 22.8%% 7.4% 52.0% 52.4% 45 3 34.2 4.62 41.2%% 48.9% 17.0% 8.4% 48.0% 76 25 1.27 21.4% 48.3% 5.5% 55.5% 55.2% 16.2 8.05 61.0% 66.7% 8.0% 51.1% 48.1% 125 16 20.1 10.06 12.3%% 45.8% 48.3% 52.6%% 116 29 5.81 48.3% 42.2% 9.2% 60.6 48.5% 47 7 48.6% 37.0% 46.1 50.7% 130 50 15.3 1.93 8 8.3% 55.3% 52.9% 70 42.3 6.54 14.7% 48.5% 64.7% 6.1% 36.5% 51.7% 175 14.9 17.88 0.0% 52.8% 38.9% 45.3% 26.5 8.27 63.3% 50.5% 30.7% 11.9% 57.3% 55.6% 125 54 31.5 5.76 0.2% 12 54.7% 41.4 4.41 52.9% 50.1% 64.4% 52.8% 16.9 9.57 32.8%% 14 53.6% 10.0% 55.0% 61 29 20.2 1.17 17.9% 52.1% 106 10 44.7% 5.7% 43.6% 51.0% 181 26.9 6.01 0.0% 17 19.6% 46.0% 375 17 77.5 10.94 30.1% 18 52.2% 42.2% 42.0% 207 10 7.19 19 49.9% 91.8%% 18.3% 67.0% 55.1% 17 28.6 10.74 0.0% 23.8%% 132 6.34 22.4%% 21 43.3% 12.9% 47.6% 86 69 30.8 41.1% 22 52.9% 39.0% 52.4%% 53.6% 178 76.1%% 32.0% 66.0% 24.1% 24 52.4% 27.9% 48.7% 50.4% 96 31 44.2 3.52 5.5% 46.8% 45.9% 52.9% 96 26 77.8%% 18.6% 48.1% 75 10.3 8.1% 50.5% 47.4 75 64.2 7.98 0.0% 28 47.2% 6.5% 47.9% 46 15 34.2 9.10 48.8% 44.8% 168 39.5 83.0%% 51.6% 56.1% 13.8%% 118 17.9 31 46.2% 31.8% 51.1% 48.6% 37 54.4 16.18 31.4% 21.5% 5.6% 52.6% 47.2% 26 78.6 8.40 26.8%% 43.7% 112 34 57.0% 30.3% 16.4% 59.5% 52.9% 53 16 30.2 3.40 58.6%% 47.9% 26.5% 10.0% 137 10.4% 36 39.5% 5.0% 40.9% 49.2% 145 11.5 10.01 37 50.8% 51.9%% 47.7% 182 74.0% 38 44.9% 55.6% 33 19 39 52.4% 50.4%% 19 23.3 61.5% 14.5%% 3.16 54.6% 56.3% 48.6% 231 17.8 5.59 56.8% 66.8% 59.6% 120 11.0 2.33Call Quality Annual Agent Turnover Daily Agent Absenteeism Agent Occupancy Agent Schedule Adherence New Agent Training Annual Agent Training Hours Agent Tenure (months] Inbound Contact Handle Time (all IVR Completion Rate 43 13.0% 43.8% 42.3 109 5 9.1 7.23 0.0% 44 53.5% 52.0% 121 34.3 10.61 8.1% 50.5% 45.2% 166 29.8 11.88 0.0% 59.3% 31.9% 39.6% 30 0.0% 48.0% 52.0%% 4.6% 45.8% 159 33.1 1.77 0.0% 48 38.0%% 7.9% 44.6% 52.4% 81 0 28.3 9.04 0.0% 49 54.3% 33.4% 48.2% 50.7% 78 2 20.0%% 50 50.2% 13.8%% 3.6% 58.3% 46.7% 196 22 2.28 0.0% 51 82.8% 10.1% 37.7% 35 9 5.6 9.21 0.0% 52 30.8% 8.1%% 38.9% 46.5% 122 28.8 3.83 1.8% 53 50.6% 14.1% 1.8%% 34.7% 46.6% 257 33 3.46 12.2% 54 51.8% 8.8X 59.5% 45.9% 151 0.0% 55 55.2% 39.3% 6.6% 57.4% 60 20 22.0 7.76 64.9% 56 5.6% 39.6% 50.7% 238 46 89.0 13.21 61.4% 57 50.1% 21.7% 56.2% 32 82.3 4.07 58 49.3% 27.5% 8.0% 51.6 52.6 115 0 1.65 59 23.4%% 52.4 43.7% 55 9 6.9% 60 50.8% 52.9% 23.1% 39.6 51.3% 70 17 3.96 35.7% 51.3% 55.0% 51.4% 90 27 7.97 66.8% 62 45.4% 39.1% 49.4% 7.1 8.61 63 49.9% 10.3% 55.4% 199 23.6 7.66 64 26.8%% 2.5%% 42.1% 46.4% 59 13 59.2 6.00 0.0% 65 48.0% 21.3%% 9.6% 43.5 58.3% 164 37 36.4 8.48 46.9% 75.9% 9.9% 42.0%% 59.7% 163 24 0.6 49.4%% 48.1% 78.0% 4.3% 50.6% 156 19 11.95 0.0% 68 49.4% 34.0% 7.6% 59.4% 56.8% 132 11 16.8 69 50.4% 44.1% 18.4% 53.0% 3.8 3 1.51 40.1%% 49.2% 25.8%% 48.6 46.0% 54.9 13.9% Average 50.1% 41.9%% 8.5% 48.7% 50.6% 113 17 33.4 6.36 Max 91.8%% 23.1% 67.0% 59.7 375 122 127.6 19.63 83.0% Min 39.5% 8.9% 1.5% 31.5% 42.0% 0.6 49.9% 37.5% 7.7% 48.7% 50.6% 102 11 28.7 5.88 9.2% Record Number Call Quality Turnover Daily Agent Agent Occupancy Agent Schedule Adherence New Agent Training Annual Agent Training Hours Agent Tenure Inbound Contact contacts) (minutes) IVR Completion RateUsing the provided data. produce a daily report to outline the call centre's performance for the day. To do so. define the key performance indicators and benchmarks that you will make comparisons against. Segment and sort the data into useful categories such that it is used to produce meaningful information. In your repon, outline your ndings, recommendations and processes used to ensure data and information accuracy and integrity. Your report should show that you have: Monitored and optimised customer contact information using a management information systEm Selected and set activity and transaction records and measurements and developed testing procedures Monitored qualitative and quantitative data against the organisational standards to ensure it is accurate and correctly segmented or sorted Analysed and interpreted data for trends and patterns Prepared and presented both short-ten\" and long-ten\" call centre data to stakeholders Developed, used, analysed and managed information systems to provide reliable and appropriate information and reporting to support the effective operation of a customer contact environment