

Answered step by step
Verified Expert Solution
Question
1 Approved Answer
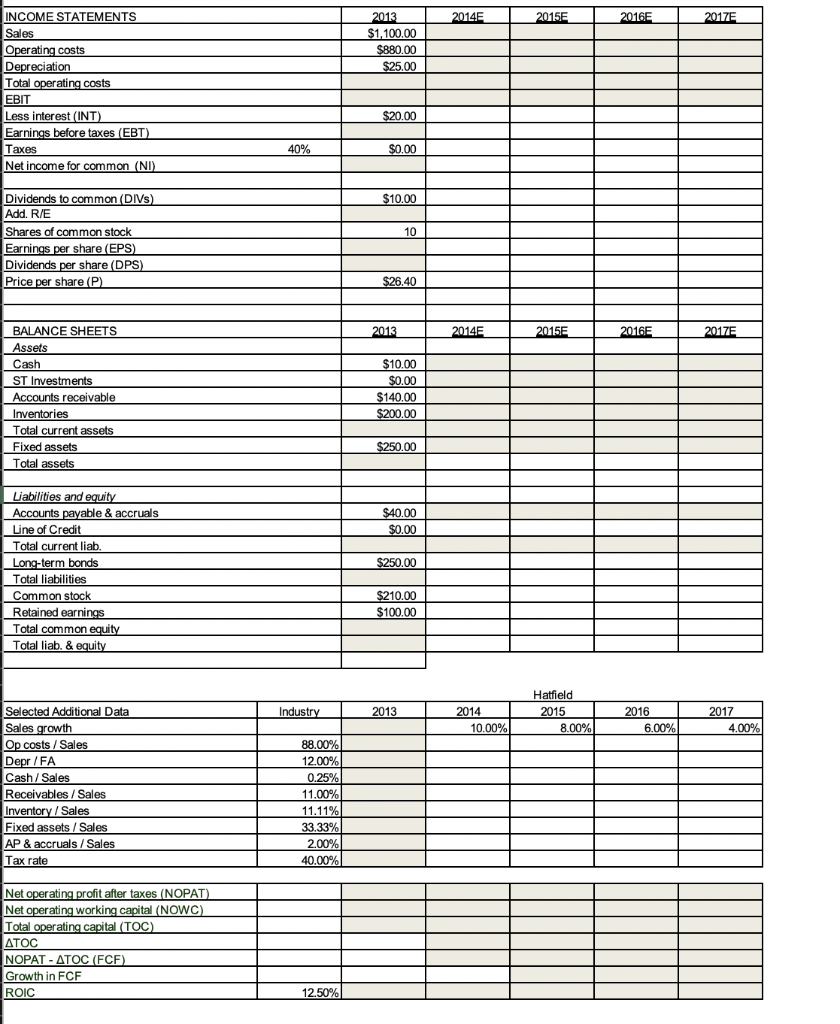
fill in the colored box 2014 2015E 2016 2017E 2013 $1,100.00 $880.00 $25.00 INCOME STATEMENTS Sales Operating costs Depreciation Total operating costs EBIT Less interest
fill in the colored box
2014 2015E 2016 2017E 2013 $1,100.00 $880.00 $25.00 INCOME STATEMENTS Sales Operating costs Depreciation Total operating costs EBIT Less interest (INT) Earnings before taxes (EBT) Taxes Net income for common (NI) $20.00 40% $0.00 $10.00 10 Dividends to common (DIVs) Add. R/E Shares of common stock Earnings per share (EPS) Dividends per share (DPS) Price per share (P) P $26.40 2013 2014 2015E 2016 2017E BALANCE SHEETS Assets Cash ST Investments Accounts receivable Inventories Total current assets Fixed assets Total assets $10.00 $0.00 $140.00 $200.00 $250.00 $40.00 $0.00 $250.00 Liabilities and equity Accounts payable & accruals Line of Credit Total current liab. Long-term bonds Total liabilities Common stock Retained earnings Total common equity Total liab. & equity $210.00 $100.00 Industry 2013 2014 10.00% Hatfield 2015 8.00% 2016 6.00% 2017 4.00% Selected Additional Data Sales growth Op costs / Sales Depr/FA Cash/ Sales Receivables / Sales Inventory / Sales Fixed assets / Sales AP & accruals / Sales 88.00% 12.00% 0.25% 11.00% 11.11% 33.33% 2.00% 40.00% Tax rate Net operating profit after taxes (NOPAT) Net operating working capital (NOWC) Total operating capital (TOC) ATOC NOPAT - ATOC (FCF) Growth in FCF ROIC 12.50% 2014 2015E 2016 2017E 2013 $1,100.00 $880.00 $25.00 INCOME STATEMENTS Sales Operating costs Depreciation Total operating costs EBIT Less interest (INT) Earnings before taxes (EBT) Taxes Net income for common (NI) $20.00 40% $0.00 $10.00 10 Dividends to common (DIVs) Add. R/E Shares of common stock Earnings per share (EPS) Dividends per share (DPS) Price per share (P) P $26.40 2013 2014 2015E 2016 2017E BALANCE SHEETS Assets Cash ST Investments Accounts receivable Inventories Total current assets Fixed assets Total assets $10.00 $0.00 $140.00 $200.00 $250.00 $40.00 $0.00 $250.00 Liabilities and equity Accounts payable & accruals Line of Credit Total current liab. Long-term bonds Total liabilities Common stock Retained earnings Total common equity Total liab. & equity $210.00 $100.00 Industry 2013 2014 10.00% Hatfield 2015 8.00% 2016 6.00% 2017 4.00% Selected Additional Data Sales growth Op costs / Sales Depr/FA Cash/ Sales Receivables / Sales Inventory / Sales Fixed assets / Sales AP & accruals / Sales 88.00% 12.00% 0.25% 11.00% 11.11% 33.33% 2.00% 40.00% Tax rate Net operating profit after taxes (NOPAT) Net operating working capital (NOWC) Total operating capital (TOC) ATOC NOPAT - ATOC (FCF) Growth in FCF ROIC 12.50% Step by Step Solution
There are 3 Steps involved in it
Step: 1

Get Instant Access to Expert-Tailored Solutions
See step-by-step solutions with expert insights and AI powered tools for academic success
Step: 2

Step: 3
Ace Your Homework with AI
Get the answers you need in no time with our AI-driven, step-by-step assistance
Get Started
Accounting And Audit With Bank Securities Theory Methodology Practice Improvement Of Accounting And Audit Of Operations With Securities Issued By The Bank
Authors: Viktorija Koval'chuk, Igor' Shhurov
1st Edition
620600032X, 978-6206000327