Financial planning cases 14-6
A College Student Ponders Investing in the Stock Market
Ji Wu of Troy, New York, has $5,000 that he wants to invest in the stock market. Ji is in college on a scholarship and does not plan to use the $5,000 or any dividend income for another five years, when he plans to buy a home. He is currently considering a small company stock selling for $30 per share with an EPS of $2.00. Last year, the company earned $1,000,000, of which $250,000 was paid out in dividends.
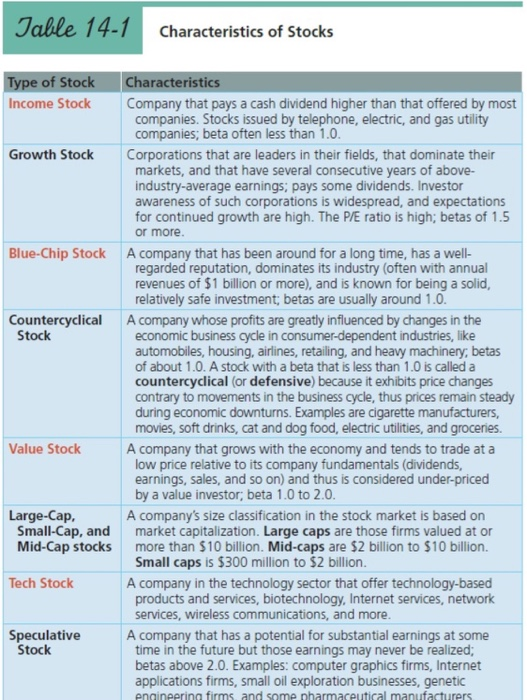
Review Table 14-1. What classification of common stock would you recommend to Ji?
Why?
The input in the box below will not be graded, but may be reviewed and considered by your instructor.
___________ explain
Calculate the P/E ratio and the dividend payout ratio for this stock. Round your answers to the nearest whole number.
P/E ratio _________
Dividend payout ratio_____ %
Given this information and your recommendation, would this stock be an appropriate purchase for Ji? Why or why not?
The input in the box below will not be graded, but may be reviewed and considered by your instructor.
___________ explain
Identify the components of the total return Ji might expect, and estimate how much he might expect annually from each component.
The input in the box below will not be graded, but may be reviewed and considered by your instructor.
_________ explain
Review the section titled Evaluate Stocks Using Corporate Earnings and select two that you think Ji would utilize to evaluate when investing in stocks. Explain why.
The input in the box below will not be graded, but may be reviewed and considered by your instructor.
________ explain


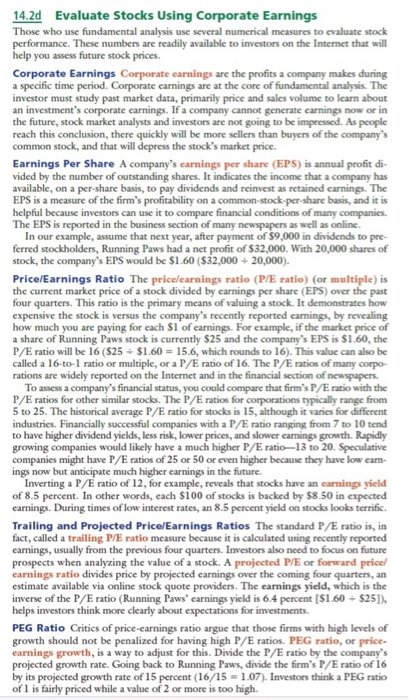
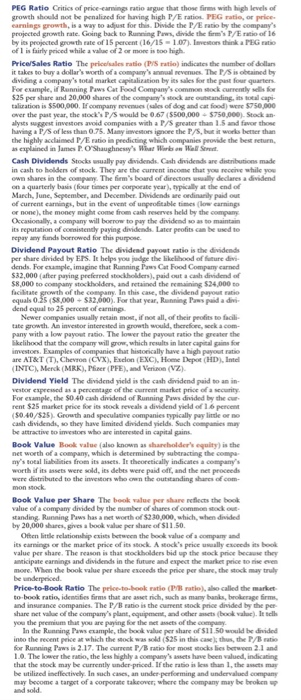
Table 14-1 Characteristics of Stocks Type of Stock Income Stock Growth Stock Blue-Chip Stock Countercyclical Stock Characteristics Company that pays a cash dividend higher than that offered by most companies. Stocks issued by telephone, electric, and gas utility companies, beta often less than 1.0. Corporations that are leaders in their fields, that dominate their markets, and that have several consecutive years of above- industry-average earnings, pays some dividends. Investor awareness of such corporations is widespread, and expectations for continued growth are high. The P/E ratio is high; betas of 1.5 or more. A company that has been around for a long time, has a well- regarded reputation, dominates its industry (often with annual revenues of $1 billion or more), and is known for being a solid, relatively safe investment; betas are usually around 1.0. A company whose profits are greatly influenced by changes in the economic business cycle in consumer-dependent industries, like automobiles, housing, airlines, retailing, and heavy machinery, betas of about 1.0. A stock with a beta that is less than 1.0 is called a countercyclical (or defensive) because it exhibits price changes contrary to movements in the business cycle, thus prices remain steady during economic downturns. Examples are cigarette manufacturers, movies, soft drinks, cat and dog food, electric utilities, and groceries A company that grows with the economy and tends to trade at a low price relative to its company fundamentals (dividends, earnings, sales, and so on) and thus is considered under-priced by a value investor, beta 1.0 to 2.0. A company's size classification in the stock market is based on market capitalization. Large caps are those firms valued at or more than $10 billion. Mid-caps are $2 billion to $10 billion. Small caps is $300 million to $2 billion. A company in the technology sector that offer technology-based products and services, biotechnology, Internet services, network services, wireless communications, and more. A company that has a potential for substantial earnings at some time in the future but those earnings may never be realized; betas above 2.0. Examples: computer graphics firms, Internet applications firms, small oil exploration businesses, genetic engineering firms and come nharmaceutical manufacturers Value Stock Large-Cap. Small-Cap, and Mid-Cap stocks Tech Stock Speculative Stock 14.2d Evaluate Stocks Using Corporate Earnings Those who use fundamental analysis use several numerical measures to evaluate stock performance. These numbers are readily available to investors on the Internet that will help you assess future stock prices. Corporate Earnings Corporate earnings are the profits a company makes during a specific time period. Corporate earnings are at the core of fundamental analysis. The investor must study past market data, primarily price and sales volume to learn about an investment's corporate earnings. If a company cannot generate carnings now or in the future, stock market analysts and investors are not going to be impressed. As people reach this conclusion, there quickly will be more sellers than buyers of the company's common stock, and that will depress the stock's market price Earnings Per Share A company's earnings per share (EPS) is annual profit do vided by the number of outstanding shares. It indicates the income that a company has available, on a per share basis, to pay dividends and reinvest as retained earnings. The EPS is a measure of the firm's profitability on a common-stock-per-share basis, and it is helpful because investors can use it to compare financial conditions of many companies. The EPS is reported in the business section of many newspapers as well as online. In our example, assume that next year, after payment of $9,000 in dividends to pre- ferred stockholders, Running Paws had a net profit of $32,000. With 20,000 shares of stock, the company's EPS would be $1.60 ($32,000 - 20,000). Price/Earnings Ratio The pricelearnings ratio (P/E ratio) (or multiple) is the current market price of a stock divided by earnings per share (EPS) over the past four quarters. This ratio is the primary means of valuing a stock. It demonstrates how expensive the stock is versus the company's recently reported earnings, by revealing how much you are paying for cach Sl of earnings. For example, if the market price of a share of Running Paws stock is currently $25 and the company's EPS is $1.60, the P/E ratio will be 16 ($25 + $1.60 = 15.6, which rounds to 16). This value can also be called a 16-to-1 ratio or multiple, or a P/E ratio of 16. The P/E ratios of many corpo rations are widely reported on the Internet and in the financial section of newspapers To assess a company's financial status, you could compare that firm's P/E ratio with the P/E ratios for other similar stocks. The P/E ratios for corporations typically range from 5 to 25. The historical average P/E ratio for stocks is 15, although it varies for different industries. Financially successful companies with a P/E ratio ranging from 7 to 10 tend to have higher dividend yields, less risk, lower prices, and slower earnings growth. Rapidly growing companies would likely have a much higher P/E ratio-13 to 20. Speculative companies might have P/E ratios of 25 or 50 or even higher because they have low eam- ings now but anticipate much higher earnings in the future. Inverting a P/E ratio of 12, for example, reveals that stocks have an earnings yield of 8.5 percent. In other words, each $100 of stocks is backed by $8.50 in expected earnings. During times of low interest rates, an 8.5 percent yield on stocks looks terrific. Trailing and Projected Price/Earnings Ratios The standard P/E ratio is, in fact, called a trailing PE ratio measure because it is calculated using recently reported carnings, usually from the previous four quarters. Investors also need to focus on future prospects when analyzing the value of a stock. A projected P/E or forward price earnings ratio divides price by projected earnings over the coming four quarters, an estimate available via online stock quote providers. The earnings yield, which is the inverse of the P/E ratio (Running Paws' carnings yield is 6.4 percent ($1.60 - $25]). helps investors think more clearly about expectations for investments. PEG Ratio Critics of price-carnings ratio argue that those firms with high levels of growth should not be penalized for having high P/E ratios. PEG ratio, or price earnings growth, is a way to adjust for this. Divide the P/E ratio by the company's projected growth rate. Going back to Running Paws, divide the firm's P/E ratio of 16 by its projected growth rate of 15 percent (16/15 = 1.07). Investors think a PEG ratio of 1 is fairly priced while a value of 2 or more is too high. PEG Ratio Critics of price-caming ratio argue that those firms with high levels of growth should not be penalined for having high P/Eratos PEG rate, or price earnings growth, is a way to adjust for this Divide the P atio the company's projected growth rate Going back to Runwing s , divide the firm' P/Em of 16 by its projected growth rate of 15 percent (16/15 - 107). Leto think a PEGO ofl is fairly priced while a value of 2 or more is too high Price/Sales Ratio The price ratio (PMS ratio) indicates the number of dollars it takes to buy a dollar's worth of a company's annual Revenues. The P/S is obtained by dividing a company's total market capitalization by its salles for the past four quarters For example, if Running Paws Cat Food Company's common stock currently sells for $25 per share and 20,000 shares of the company's stock are tanding, is total capi- talization is $500,000. If company r esales of dog and cat food) were $750,000 over the past year, the stockP/Swould be 0.67 ($500,000 - $750,000). Stock an alysts suggest investors avoid companies with a P/S greater than 1.5 and favor those having a P/S of less than 0.75. Many investors ince the P/S, but it works better than the highly acclaimed P/Erate in predicting which companies provide the best retur, is explained in James P. O'Shaughnessy's What W e Heart Cash Dividends Stocksually pay dividende. Cash dividends are distributions made in cash to holders of stock. They are the current income that you while you own shares in the company. The firm's board of director y declares a dividend on a quarterly basis four times per corporate year), typically at the end of March, June, September, and December. Dividends are ordinary paid out of current carming, but in the event of unprofitable times low carnings or none), the money might come from cash roves held by the company Occasionally, a company will borrow to pay the dividendo as to maintain its reputation of consistently paying dividends. Later protits can be used to repay any funds borrowed for this purpose. Dividend Payout Ratio The dividend payout ratio is the dividends per share divided by EPS. It helps you judge the likelihood of future divi dends. For example, imagine that Running Cat Food Company carned $32,000 after paying preferred stockholders), paid out a cash dividend of $8,000 to company stockholders, and retained the remaining $24,000 to facilitate growth of the company. In this case, the dividend payout ratio equals 0.35 (58.000 - $22.000). For that year, Running Pows paid a divi dend equal to 25 percent of earnings Newer companies usually retain mo, if not all of their petits to facili tate growth. An investor interested in growth would, therefore, secka.com pany with a low payout ratio. The lower the payout ratio the greater the kelihood that the company will grow, which results in later capital gains for investors. Examples of companies that historically have a high payout ratio are AT&T (T), Chevron (CVX), Eco (EXC, Home Depot (HD, Intel INTC Merck (MRK), (PFE), Verizon (VZ) Dividend Yield The dividend yield is the cash dividend paid to an in- vestor expressed as a percentage of the current market price of a security For example, the SO 40 cash dividend of Running Paws dvided by the rent $25 market price for its stock reveals a dividend yield of 16 percent 50.40/825). Growth and speculative companies typically pay it or no cash dividende, so they have limited dividend yields. Such companies may be attractive to investors who are interested in capital gains. Book Value Book value (also known as h olders uity) is the net worth of a company, which is determined by subtracting the compa ny's total liabilities from its assets. It theoretically indicates a company's worth of its sets were sold, its debts were paid off, and the net proceeds were distributed to the investors who on the outstanding shares of com- mon stock Book Value per Share The book value per share reflects the book value of a company divided by the number of shares of comme stock out standing, Running Paws has a net worth of $230,000, which, when divided by 20,000 shares, gives a book value per share of $11.50 Often little relationship exist en the book value of a company and value per share. The reason is that stockholders bid up the stock price because they anticipate earnings and dividends in the future and expect the market price to even more. When the book value per share exceeds the price per share the stock may truly be underpriced. Price-to-Book Ratio The police tobook ratio (P rato), also called the market to-book ratio, identifies firms that are a t rich, such as many banks, brokerage firms and insurance companies. The P/B ratio is the current stock price divided by the per share net value of the company's plant, equipment, and other its book value). It tell you the premium that you are paying for the net of the In the Running Paws cample, the back value per share of $11.50 would be divided into the recent price at which the stock was sold ($25 in this case, thus, the P/B ratio for Running Paws is 2.17. The current P/B ratio for most stocks lies between 2.1 and 1.0. The lower the to, the less highly a company's assets have been valued, indicating that the stock may be currently under-priced. If the ratio is less than the acts may be utilized ineffectively. In such cases, an under performing and undervalued company may become a target of a corporate tako, where the company may be broken


