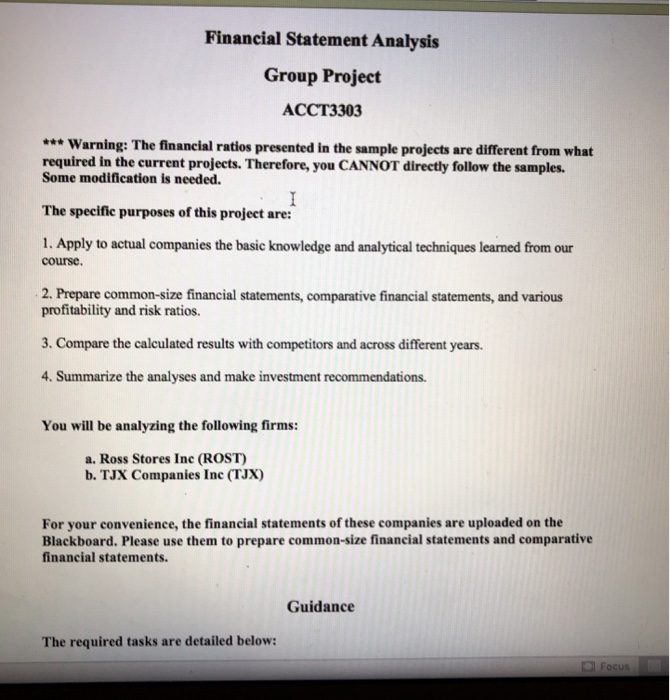
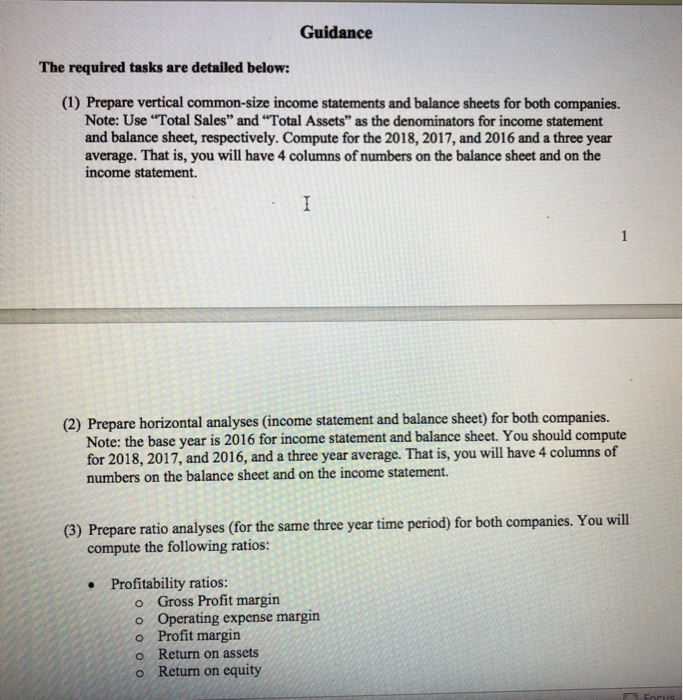
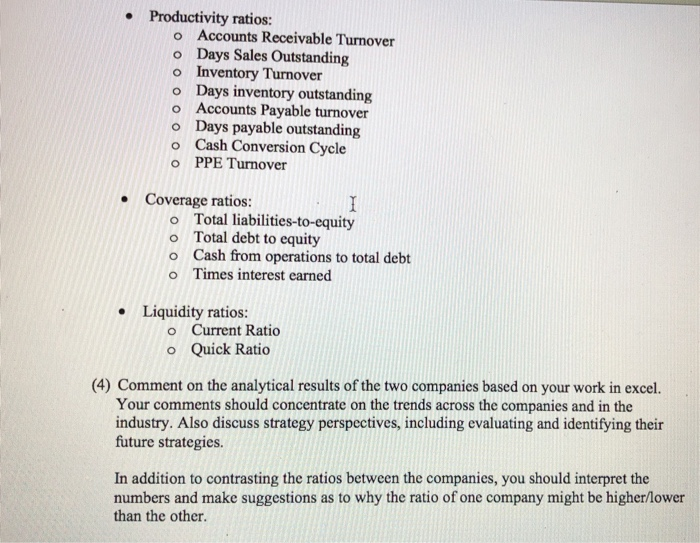
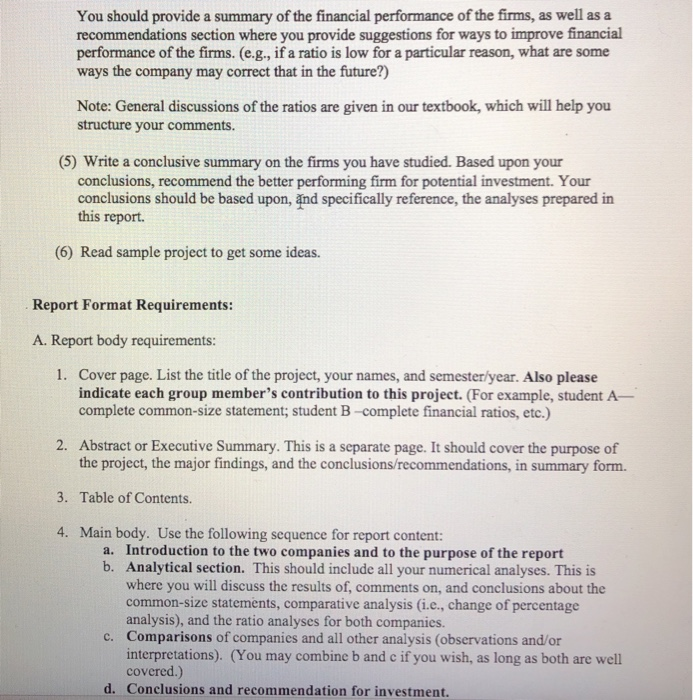
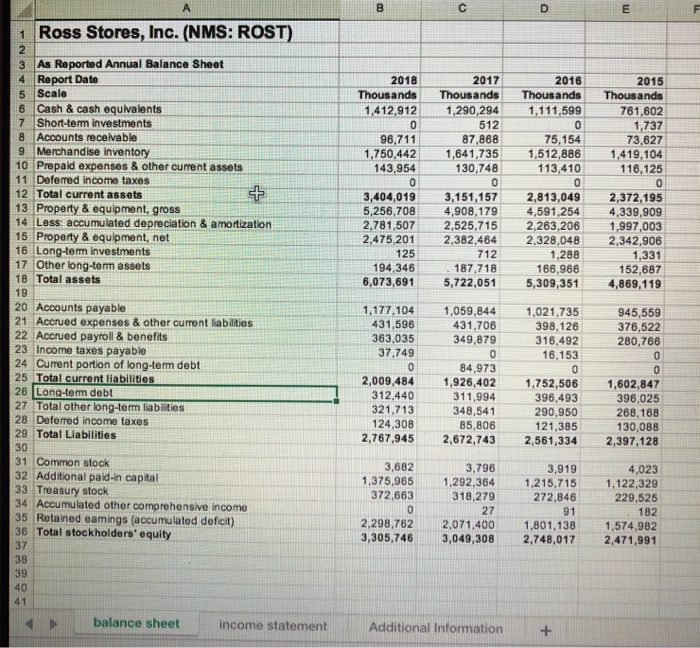
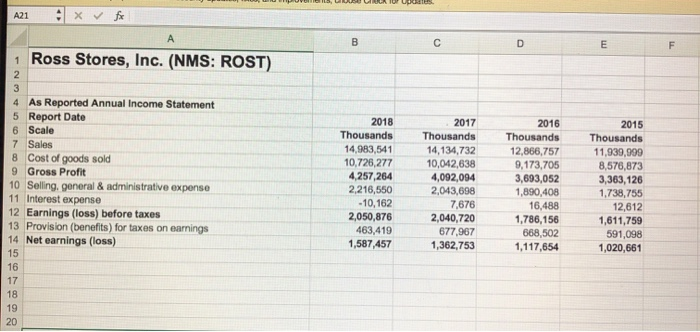
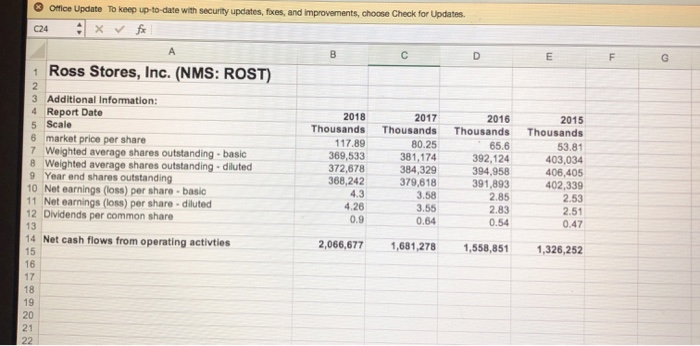
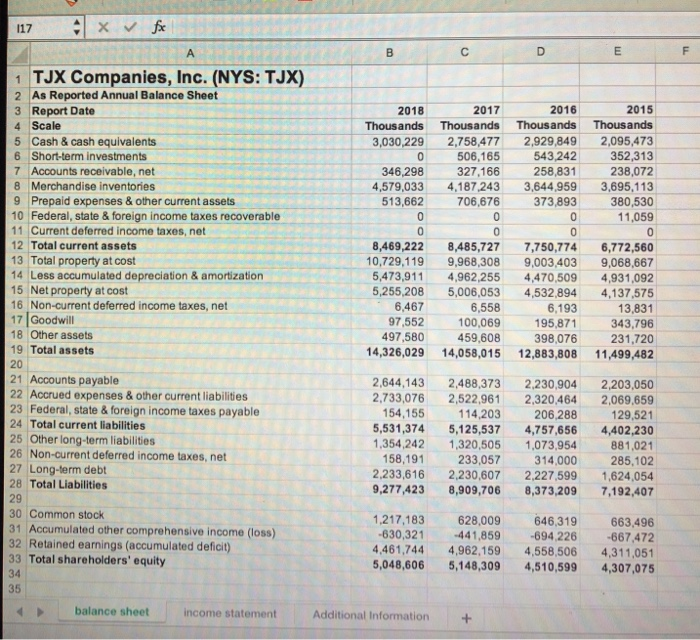
Financial Statement Analysis Group Project ACCT3303 *** Warning: The financial ratios presented in the sample projects are different from what required in the current projects. Therefore, you CANNOT directly follow the samples. Some modification is needed. The specific purposes of this project are: 1. Apply to actual companies the basic knowledge and analytical techniques learned from our course. 2. Prepare common-size financial statements, comparative financial statements, and various profitability and risk ratios. 3. Compare the calculated results with competitors and across different years. 4. Summarize the analyses and make investment recommendations. You will be analyzing the following firms: a. Ross Stores Inc (ROST) b. TJX Companies Inc (TJX) For your convenience, the financial statements of these companies are uploaded on the Blackboard. Please use them to prepare common-size financial statements and comparative financial statements. Guidance The required tasks are detailed below: Ol Focus Guidance The required tasks are detailed below: (1) Prepare vertical common-size income statements and balance sheets for both companies. Note: Use "Total Sales" and "Total Assets" as the denominators for income statement and balance sheet, respectively. Compute for the 2018, 2017, and 2016 and a three year average. That is, you will have 4 columns of numbers on the balance sheet and on the income statement (2) Prepare horizontal analyses (income statement and balance sheet) for both companies. Note: the base year is 2016 for income statement and balance sheet. You should compute for 2018, 2017, and 2016, and a three year average. That is, you will have 4 columns of numbers on the balance sheet and on the income statement. (3) Prepare ratio analyses (for the same three year time period) for both companies. You will compute the following ratios: Profitability ratios: o Gross Profit margin o Operating expense margin o Profit margin o Return on assets o Return on equity Productivity ratios: o Accounts Receivable Turnover o Days Sales Outstanding o Inventory Turnover o Days inventory outstanding o Accounts Payable turnover o Days payable outstanding o Cash Conversion Cycle o PPE Turnover Coverage ratios: o Total liabilities-to-equity Total debt to equity o Cash from operations to total debt o Times interest earned Liquidity ratios: o Current Ratio O Quick Ratio (4) Comment on the analytical results of the two companies based on your work in excel. Your comments should concentrate on the trends across the companies and in the industry. Also discuss strategy perspectives, including evaluating and identifying their future strategies. In addition to contrasting the ratios between the companies, you should interpret the numbers and make suggestions as to why the ratio of one company might be higher/lower than the other. You should provide a summary of the financial performance of the firms, as well as a recommendations section where you provide suggestions for ways to improve financial performance of the firms. (e.g., if a ratio is low for a particular reason, what are some ways the company may correct that in the future?) Note: General discussions of the ratios are given in our textbook, which will help you structure your comments. (5) Write a conclusive summary on the firms you have studied. Based upon your conclusions, recommend the better performing firm for potential investment. Your conclusions should be based upon, and specifically reference, the analyses prepared in this report. (6) Read sample project to get some ideas. Report Format Requirements: A. Report body requirements: 1. Cover page. List the title of the project, your names, and semester/year. Also please indicate each group member's contribution to this project. (For example, student A- complete common-size statement; student B-complete financial ratios, etc.) 2. Abstract or Executive Summary. This is a separate page. It should cover the purpose of the project, the major findings, and the conclusions/recommendations, in summary form. 3. Table of Contents. 4. Main body. Use the following sequence for report content: a. Introduction to the two companies and to the purpose of the report b. Analytical section. This should include all your numerical analyses. This is where you will discuss the results of, comments on, and conclusions about the common-size statements, comparative analysis (i.e., change of percentage analysis), and the ratio analyses for both companies. c. Comparisons of companies and all other analysis (observations and/or interpretations). (You may combine b and c if you wish, as long as both are well covered.) d. Conclusions and recommendation for investment. 5. References. List all major reference sources. 6. Appendices. a. Include tables and graphs of your numerical analyses. For both companies, you should report: common-size statements, comparative analysis statement, a table of Financial Statement Ratios, and Pro Forma statements. Please see the sample project's Appendices--table 1 to table 14 as examples b. For reference convenience, assign a title to each separate item, such as Table 1, Exhibit 1, etc. B. Typesetting requirements: 1. Use size 12 font. Times New Roman is preferred. 2. Double space between lines. 3. Number pages in accordance with the APA style guide. 4. One inch on all sides. 5. Do not right justify text. Use left justify. 6. Minimum length: 8 pages. (Note: You can easily meet the minimum length requirement since you will have a lot of tables in the paper.) 7. The submitted work should be in ONE file with a word or pdf format. An Excel spreadsheet file is NOT acceptable. D 1 Ross Stores, Inc. (NMS: ROST) 2016 Thousands 1,111,599 2018 Thousands 1,412,912 O 96.711 1,750,442 143,954 2015 Thousands 761,602 1,737 73,627 1,419,104 1 16,125 2017 Thousands 1,290,294 512 87,868 1,641,735 130,748 O 3,151,157 4,908,179 2,525,715 2,382,464 712 187,718 5,722,051 3,404,019 5,256,708 2.781,507 2,475,201 125 194,346 6,073,691 75,154 1,512,886 113,410 0 2,813,049 4,591,254 2,263,206 2,328,048 1.288 166,966 5,309,351 2,372,195 4,339,909 1.997.003 2,342,906 1,331 152,687 4,869,119 3 As Reported Annual Balance Sheet 4 Report Date 5 Scale 6 Cash & cash equivalents 7 Short-term investments 8 Accounts receivable 9 Merchandise inventory 10 Prepaid expenses & other current assets 11 Deferred income taxes 12 Total current assets 13 Property & equipment, gross 14 Less: accumulated depreciation & amortization 15 Property & equipment, net 16 Long-term investments 17 Other long-term assets 18 Total assets 19 20 Accounts payable 21 Accrued expenses & other current liabilities 22 Accrued payroll & benefits 23 Income taxes payable 24 Current portion of long-term debt 25 Total current liabilities 26 Long-term debt 27 Total other long-term liabilities 28 Deferred income taxes 29 Total Liabilities 30 31 Common stock 32 Additional paid-in capital 33 Treasury stock 34 Accumulated other comprehensive income 35 Retained earings (accumulated deficit) 36 Total stockholders' equity 1,177,104 431,596 363,035 37.749 1,059,844 431,706 349,879 1,021,735 398,126 316,492 16,153 945,559 376,522 280.766 2,009,484 312,440 321,713 124,308 2,767,945 84,973 1,926,402 311,994 348,541 85,806 2,672,743 1,752,506 396,493 290,950 121,385 2,561,334 1,602,847 396,025 268,168 130,088 2,397,128 3,682 1,375,965 372,663 3,796 1,292,364 318,279 27 2,071,400 3,049,308 3,919 1,215,715 272,846 4,023 1,122,329 229,525 182 1,574,982 2,471,991 91 2,298,762 3,305,746 1,801,138 2,748,017 balance sheet income statement Additional Information A21 A fx 1 Ross Stores, Inc. (NMS: ROST) 4 As Reported Annual Income Statement 5 Report Date 6 Scale 7 Sales 8 Cost of goods sold 9 Gross Profit 10 Seling, general & administrative expense 11 Interest expense 12 Earnings (loss) before taxes 13 Provision (benefits) for taxes on earnings 14 Net earnings (loss) 2018 Thousands 14,983,541 10,726,277 4.257,264 2,216,550 -10,162 2,050,876 463,419 1,587,457 2017 Thousands 14,134,732 10,042,638 4,092,094 2,043,698 7,676 2,040,720 677,967 1,362,753 2016 Thousands 12,866,757 9,173,705 3,693,052 1,890,408 16.488 1,786,156 668,502 1,117,654 2015 Thousands 11,939,999 8,576,873 3,363,126 1,738,755 12,612 1,611,759 591,098 1,020,661 Office Update To keep up-todate with security updates, foxes, and improvements, choose Check for Updates c24 : fx 1 Ross Stores, Inc. (NMS: ROST) 3 Additional Information: 4 Report Date 5 Scale 6 market price per share 7 Weighted average shares outstanding basic 8 Weighted average shares outstanding - diluted 9 Year and shares outstanding 10 Net earnings (los) per share basic 11 Net earnings (los) per share-diluted 12 Dividends per common share 2018 Thousands 117.89 369,533 372,678 368,242 2017 Thousands 80.25 381,174 384,329 379,618 3.58 2016 Thousands 65.6 392,124 394,958 391,893 2.85 2.83 0.54 2015 Thousands 53.81 403,034 406,405 402,339 2.53 2.51 0.47 3.55 4.26 0.9 0.64 13 14 Net cash flows from operating activties 2,066,677 1,681,278 1,558,851 1,326,252 117 x fe DE A 1 TJX Companies, Inc. (NYS: TJX) 2 As Reported Annual Balance Sheet 3 Report Date 4 Scale 5 Cash & cash equivalents 6 Short-term investments 7 Accounts receivable, net 8 Merchandise inventories 9 Prepaid expenses & other current assets 10 Federal, state & foreign income taxes recoverable 11 Current deferred income taxes, net 12 Total current assets 13 Total property at cost 14 Less accumulated depreciation & amortization 15 Net property at cost 16 Non-current deferred income taxes, net 17 Goodwill 18 Other assets 19 Total assets 2018 Thousands 3,030,229 3,030,229 0 346,298 4,579,033 513,662 2017 Thousands 2,758,477 506,165 327,166 4,187,243 706,676 2016 Thousands 2,929,849 543,242 258,831 3,644,959 373,893 O 2015 Thousands 2,095,473 352,313 2 38,072 3,695,113 380,530 11,059 0 6,772,560 9,068,667 4,931,092 4,137,575 13,831 343,796 231,720 11,499,482 8,469,222 10.729.119 5,473,911 5,255,208 6,467 97,552 497,580 14,326,029 net 8,485,727 9,968,308 4,962,255 5,006,053 6,558 100,069 459,608 14,058,015 7,750,774 9,003,403 4,470,509 4,532,894 6,193 195,871 398,076 12,883,808 20 21 Accounts payable 22 Accrued expenses & other current liabilities 23 Federal, state & foreign income taxes payable 24 Total current liabilities 25 Other long-term liabilities 26 Non-current deferred income taxes, net 27 Long-term debt 28 Total Liabilities 2,644,143 2,733,076 154,155 5,531,374 1,354,242 158,191 2,233,616 9,277,423 2,488,373 2,522,961 114,203 5,125,537 1,320,505 233,057 2,230,607 8,909,706 2.230,904 2,320,464 206,288 4,757,656 1,073,954 314,000 2,227,599 8,373,209 2,203,050 2,069,659 129,521 4,402,230 881,021 285,102 1,624,054 7,192,407 29 30 Common stock 31 Accumulated other comprehensive income (loss) 32 Retained earnings (accumulated deficit) 33 Total shareholders' equity 34 1,217,183 -630,321 4,461,744 5,048,606 628,009 646,319 -441,859 -694,226 4,962,1594,558,506 5,148,309 4,510,599 663,496 -667.472 4,311,051 4,307,075 35 balance sheet income statement Additional Information TJX Companies, Inc. (NYS: TJX) As Reported Annual Income Statement Report Date Scale 2018 Thousan 2017 2016 2015 Thousan Thousan Thousan 2014 Thousan ds de W 5 Net sales 6 Cost of sales, including buying & occupancy costs 7 Gross Profit 8 Seling, general & administrative expenses 9 Impairment of goodwil 8 other long-lived assets, related to Sierra Trading Post (STP) 10 Gain (loss) on early extinguishment of debt 11 Pension settlement charge 12 Interest expense 13 Income (loss) before provision for income taxes 14 Provision for benefit from income taxes 15 Net Income (loss) A B 9,617,990 0,910,415 8,301,885 6,923 584 6.375,071 5.768,457 5205.715 4.695,394 0 99 250 0 51,773 0 16,830 38,122 0 31,173 8.880 31.588 4 3.534 48.400 39,787 4,173,211 3.856,588 3,723,043 3,658,300 3,549,884 1,113,413 1248 640 1,424,809 1.380,642 1,334,756 3,059,798 2,607,948 2.298,234 2.277,658 2215.128 B C D E F TJX Companies, Inc. (NYS: TJX) Additional Information 4 Report Date 2015 Thousands 2014 Thousands 78.12 70.91 market price per share 7 Weighted average shares outstanding basic 8 Weighted average shares outstanding diluted Year and share outstanding 10 Cash dividends declared per share 11 Neteamings (los) per share basic 12 Natoamings (loss) per share-diluted Thousands 61.95 1,241,153 1289,252 1,217,183 0.78 2017 Thousands 78.46 638 827 648,105 628.000 2016 Thousands 75.13 55,847 684 432 646,319 673 484 883 251 863 498 014 692.691 703 545 705,017 0 0 320 3.15 104 338 351 3.46 2.43 404 333 14 Net cash flows from operating activities 4,088,459 3,025,624 3,601,894 2.937343 3,008,369 Financial Statement Analysis Group Project ACCT3303 *** Warning: The financial ratios presented in the sample projects are different from what required in the current projects. Therefore, you CANNOT directly follow the samples. Some modification is needed. The specific purposes of this project are: 1. Apply to actual companies the basic knowledge and analytical techniques learned from our course. 2. Prepare common-size financial statements, comparative financial statements, and various profitability and risk ratios. 3. Compare the calculated results with competitors and across different years. 4. Summarize the analyses and make investment recommendations. You will be analyzing the following firms: a. Ross Stores Inc (ROST) b. TJX Companies Inc (TJX) For your convenience, the financial statements of these companies are uploaded on the Blackboard. Please use them to prepare common-size financial statements and comparative financial statements. Guidance The required tasks are detailed below: Ol Focus Guidance The required tasks are detailed below: (1) Prepare vertical common-size income statements and balance sheets for both companies. Note: Use "Total Sales" and "Total Assets" as the denominators for income statement and balance sheet, respectively. Compute for the 2018, 2017, and 2016 and a three year average. That is, you will have 4 columns of numbers on the balance sheet and on the income statement (2) Prepare horizontal analyses (income statement and balance sheet) for both companies. Note: the base year is 2016 for income statement and balance sheet. You should compute for 2018, 2017, and 2016, and a three year average. That is, you will have 4 columns of numbers on the balance sheet and on the income statement. (3) Prepare ratio analyses (for the same three year time period) for both companies. You will compute the following ratios: Profitability ratios: o Gross Profit margin o Operating expense margin o Profit margin o Return on assets o Return on equity Productivity ratios: o Accounts Receivable Turnover o Days Sales Outstanding o Inventory Turnover o Days inventory outstanding o Accounts Payable turnover o Days payable outstanding o Cash Conversion Cycle o PPE Turnover Coverage ratios: o Total liabilities-to-equity Total debt to equity o Cash from operations to total debt o Times interest earned Liquidity ratios: o Current Ratio O Quick Ratio (4) Comment on the analytical results of the two companies based on your work in excel. Your comments should concentrate on the trends across the companies and in the industry. Also discuss strategy perspectives, including evaluating and identifying their future strategies. In addition to contrasting the ratios between the companies, you should interpret the numbers and make suggestions as to why the ratio of one company might be higher/lower than the other. You should provide a summary of the financial performance of the firms, as well as a recommendations section where you provide suggestions for ways to improve financial performance of the firms. (e.g., if a ratio is low for a particular reason, what are some ways the company may correct that in the future?) Note: General discussions of the ratios are given in our textbook, which will help you structure your comments. (5) Write a conclusive summary on the firms you have studied. Based upon your conclusions, recommend the better performing firm for potential investment. Your conclusions should be based upon, and specifically reference, the analyses prepared in this report. (6) Read sample project to get some ideas. Report Format Requirements: A. Report body requirements: 1. Cover page. List the title of the project, your names, and semester/year. Also please indicate each group member's contribution to this project. (For example, student A- complete common-size statement; student B-complete financial ratios, etc.) 2. Abstract or Executive Summary. This is a separate page. It should cover the purpose of the project, the major findings, and the conclusions/recommendations, in summary form. 3. Table of Contents. 4. Main body. Use the following sequence for report content: a. Introduction to the two companies and to the purpose of the report b. Analytical section. This should include all your numerical analyses. This is where you will discuss the results of, comments on, and conclusions about the common-size statements, comparative analysis (i.e., change of percentage analysis), and the ratio analyses for both companies. c. Comparisons of companies and all other analysis (observations and/or interpretations). (You may combine b and c if you wish, as long as both are well covered.) d. Conclusions and recommendation for investment. 5. References. List all major reference sources. 6. Appendices. a. Include tables and graphs of your numerical analyses. For both companies, you should report: common-size statements, comparative analysis statement, a table of Financial Statement Ratios, and Pro Forma statements. Please see the sample project's Appendices--table 1 to table 14 as examples b. For reference convenience, assign a title to each separate item, such as Table 1, Exhibit 1, etc. B. Typesetting requirements: 1. Use size 12 font. Times New Roman is preferred. 2. Double space between lines. 3. Number pages in accordance with the APA style guide. 4. One inch on all sides. 5. Do not right justify text. Use left justify. 6. Minimum length: 8 pages. (Note: You can easily meet the minimum length requirement since you will have a lot of tables in the paper.) 7. The submitted work should be in ONE file with a word or pdf format. An Excel spreadsheet file is NOT acceptable. D 1 Ross Stores, Inc. (NMS: ROST) 2016 Thousands 1,111,599 2018 Thousands 1,412,912 O 96.711 1,750,442 143,954 2015 Thousands 761,602 1,737 73,627 1,419,104 1 16,125 2017 Thousands 1,290,294 512 87,868 1,641,735 130,748 O 3,151,157 4,908,179 2,525,715 2,382,464 712 187,718 5,722,051 3,404,019 5,256,708 2.781,507 2,475,201 125 194,346 6,073,691 75,154 1,512,886 113,410 0 2,813,049 4,591,254 2,263,206 2,328,048 1.288 166,966 5,309,351 2,372,195 4,339,909 1.997.003 2,342,906 1,331 152,687 4,869,119 3 As Reported Annual Balance Sheet 4 Report Date 5 Scale 6 Cash & cash equivalents 7 Short-term investments 8 Accounts receivable 9 Merchandise inventory 10 Prepaid expenses & other current assets 11 Deferred income taxes 12 Total current assets 13 Property & equipment, gross 14 Less: accumulated depreciation & amortization 15 Property & equipment, net 16 Long-term investments 17 Other long-term assets 18 Total assets 19 20 Accounts payable 21 Accrued expenses & other current liabilities 22 Accrued payroll & benefits 23 Income taxes payable 24 Current portion of long-term debt 25 Total current liabilities 26 Long-term debt 27 Total other long-term liabilities 28 Deferred income taxes 29 Total Liabilities 30 31 Common stock 32 Additional paid-in capital 33 Treasury stock 34 Accumulated other comprehensive income 35 Retained earings (accumulated deficit) 36 Total stockholders' equity 1,177,104 431,596 363,035 37.749 1,059,844 431,706 349,879 1,021,735 398,126 316,492 16,153 945,559 376,522 280.766 2,009,484 312,440 321,713 124,308 2,767,945 84,973 1,926,402 311,994 348,541 85,806 2,672,743 1,752,506 396,493 290,950 121,385 2,561,334 1,602,847 396,025 268,168 130,088 2,397,128 3,682 1,375,965 372,663 3,796 1,292,364 318,279 27 2,071,400 3,049,308 3,919 1,215,715 272,846 4,023 1,122,329 229,525 182 1,574,982 2,471,991 91 2,298,762 3,305,746 1,801,138 2,748,017 balance sheet income statement Additional Information A21 A fx 1 Ross Stores, Inc. (NMS: ROST) 4 As Reported Annual Income Statement 5 Report Date 6 Scale 7 Sales 8 Cost of goods sold 9 Gross Profit 10 Seling, general & administrative expense 11 Interest expense 12 Earnings (loss) before taxes 13 Provision (benefits) for taxes on earnings 14 Net earnings (loss) 2018 Thousands 14,983,541 10,726,277 4.257,264 2,216,550 -10,162 2,050,876 463,419 1,587,457 2017 Thousands 14,134,732 10,042,638 4,092,094 2,043,698 7,676 2,040,720 677,967 1,362,753 2016 Thousands 12,866,757 9,173,705 3,693,052 1,890,408 16.488 1,786,156 668,502 1,117,654 2015 Thousands 11,939,999 8,576,873 3,363,126 1,738,755 12,612 1,611,759 591,098 1,020,661 Office Update To keep up-todate with security updates, foxes, and improvements, choose Check for Updates c24 : fx 1 Ross Stores, Inc. (NMS: ROST) 3 Additional Information: 4 Report Date 5 Scale 6 market price per share 7 Weighted average shares outstanding basic 8 Weighted average shares outstanding - diluted 9 Year and shares outstanding 10 Net earnings (los) per share basic 11 Net earnings (los) per share-diluted 12 Dividends per common share 2018 Thousands 117.89 369,533 372,678 368,242 2017 Thousands 80.25 381,174 384,329 379,618 3.58 2016 Thousands 65.6 392,124 394,958 391,893 2.85 2.83 0.54 2015 Thousands 53.81 403,034 406,405 402,339 2.53 2.51 0.47 3.55 4.26 0.9 0.64 13 14 Net cash flows from operating activties 2,066,677 1,681,278 1,558,851 1,326,252 117 x fe DE A 1 TJX Companies, Inc. (NYS: TJX) 2 As Reported Annual Balance Sheet 3 Report Date 4 Scale 5 Cash & cash equivalents 6 Short-term investments 7 Accounts receivable, net 8 Merchandise inventories 9 Prepaid expenses & other current assets 10 Federal, state & foreign income taxes recoverable 11 Current deferred income taxes, net 12 Total current assets 13 Total property at cost 14 Less accumulated depreciation & amortization 15 Net property at cost 16 Non-current deferred income taxes, net 17 Goodwill 18 Other assets 19 Total assets 2018 Thousands 3,030,229 3,030,229 0 346,298 4,579,033 513,662 2017 Thousands 2,758,477 506,165 327,166 4,187,243 706,676 2016 Thousands 2,929,849 543,242 258,831 3,644,959 373,893 O 2015 Thousands 2,095,473 352,313 2 38,072 3,695,113 380,530 11,059 0 6,772,560 9,068,667 4,931,092 4,137,575 13,831 343,796 231,720 11,499,482 8,469,222 10.729.119 5,473,911 5,255,208 6,467 97,552 497,580 14,326,029 net 8,485,727 9,968,308 4,962,255 5,006,053 6,558 100,069 459,608 14,058,015 7,750,774 9,003,403 4,470,509 4,532,894 6,193 195,871 398,076 12,883,808 20 21 Accounts payable 22 Accrued expenses & other current liabilities 23 Federal, state & foreign income taxes payable 24 Total current liabilities 25 Other long-term liabilities 26 Non-current deferred income taxes, net 27 Long-term debt 28 Total Liabilities 2,644,143 2,733,076 154,155 5,531,374 1,354,242 158,191 2,233,616 9,277,423 2,488,373 2,522,961 114,203 5,125,537 1,320,505 233,057 2,230,607 8,909,706 2.230,904 2,320,464 206,288 4,757,656 1,073,954 314,000 2,227,599 8,373,209 2,203,050 2,069,659 129,521 4,402,230 881,021 285,102 1,624,054 7,192,407 29 30 Common stock 31 Accumulated other comprehensive income (loss) 32 Retained earnings (accumulated deficit) 33 Total shareholders' equity 34 1,217,183 -630,321 4,461,744 5,048,606 628,009 646,319 -441,859 -694,226 4,962,1594,558,506 5,148,309 4,510,599 663,496 -667.472 4,311,051 4,307,075 35 balance sheet income statement Additional Information TJX Companies, Inc. (NYS: TJX) As Reported Annual Income Statement Report Date Scale 2018 Thousan 2017 2016 2015 Thousan Thousan Thousan 2014 Thousan ds de W 5 Net sales 6 Cost of sales, including buying & occupancy costs 7 Gross Profit 8 Seling, general & administrative expenses 9 Impairment of goodwil 8 other long-lived assets, related to Sierra Trading Post (STP) 10 Gain (loss) on early extinguishment of debt 11 Pension settlement charge 12 Interest expense 13 Income (loss) before provision for income taxes 14 Provision for benefit from income taxes 15 Net Income (loss) A B 9,617,990 0,910,415 8,301,885 6,923 584 6.375,071 5.768,457 5205.715 4.695,394 0 99 250 0 51,773 0 16,830 38,122 0 31,173 8.880 31.588 4 3.534 48.400 39,787 4,173,211 3.856,588 3,723,043 3,658,300 3,549,884 1,113,413 1248 640 1,424,809 1.380,642 1,334,756 3,059,798 2,607,948 2.298,234 2.277,658 2215.128 B C D E F TJX Companies, Inc. (NYS: TJX) Additional Information 4 Report Date 2015 Thousands 2014 Thousands 78.12 70.91 market price per share 7 Weighted average shares outstanding basic 8 Weighted average shares outstanding diluted Year and share outstanding 10 Cash dividends declared per share 11 Neteamings (los) per share basic 12 Natoamings (loss) per share-diluted Thousands 61.95 1,241,153 1289,252 1,217,183 0.78 2017 Thousands 78.46 638 827 648,105 628.000 2016 Thousands 75.13 55,847 684 432 646,319 673 484 883 251 863 498 014 692.691 703 545 705,017 0 0 320 3.15 104 338 351 3.46 2.43 404 333 14 Net cash flows from operating activities 4,088,459 3,025,624 3,601,894 2.937343 3,008,369
