

Answered step by step
Verified Expert Solution
Question
1 Approved Answer
first photo is info that needs to be used the other photos are a example of the problem and how it should be done and
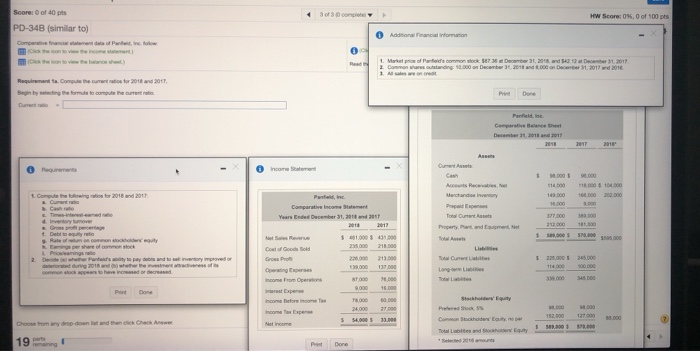
first photo is info that needs to be used
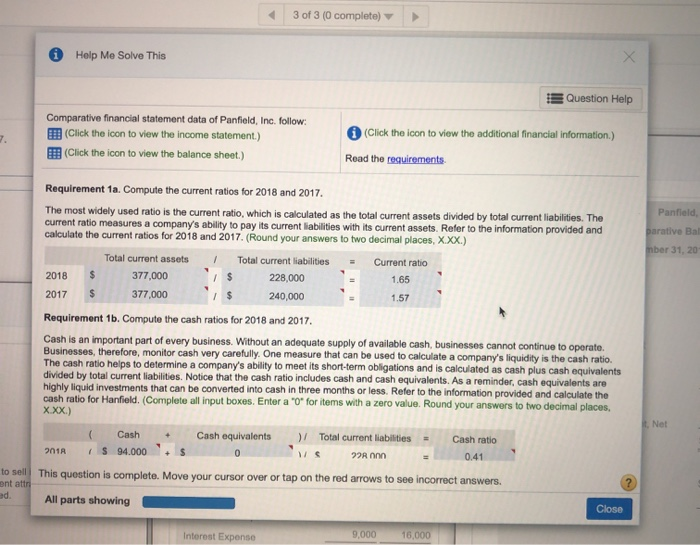
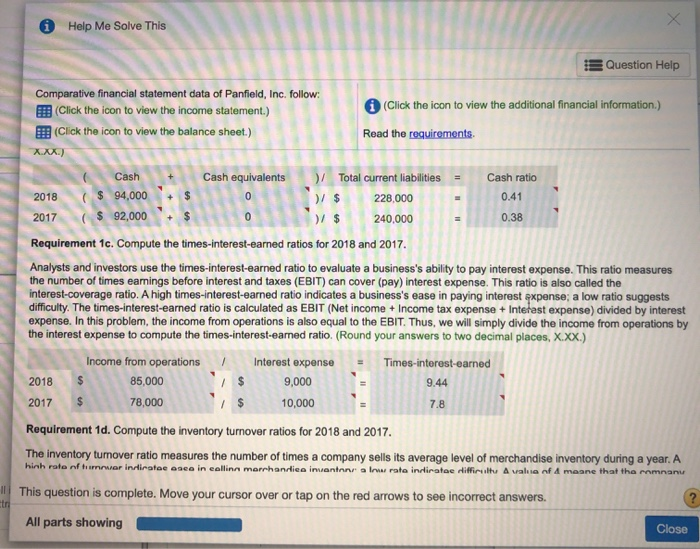
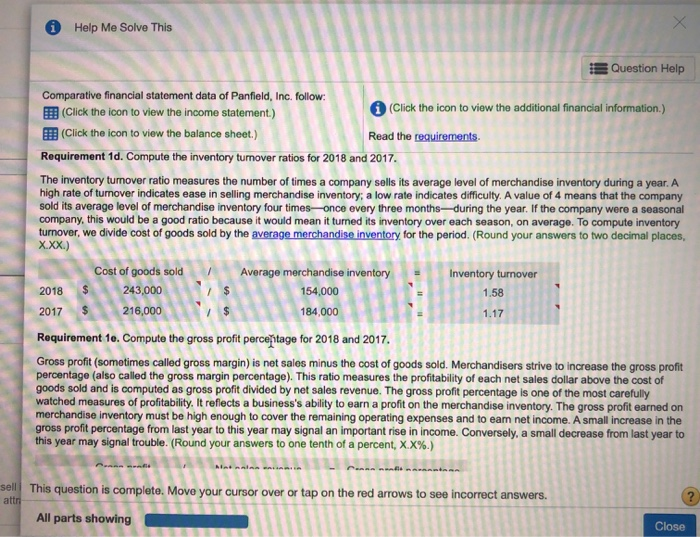
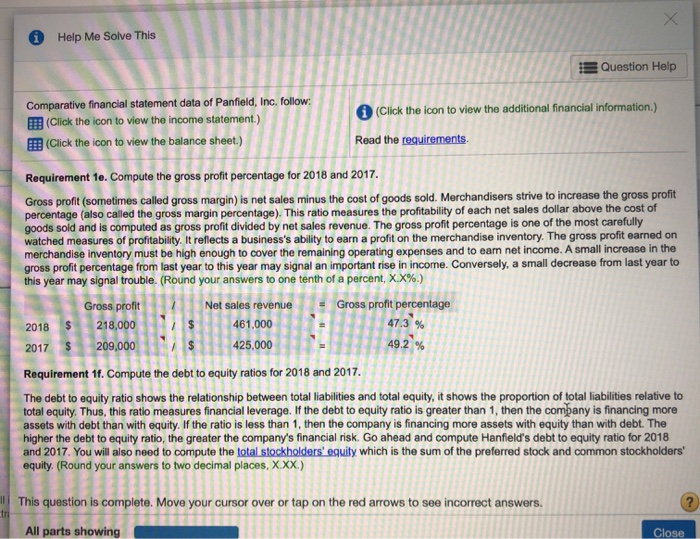
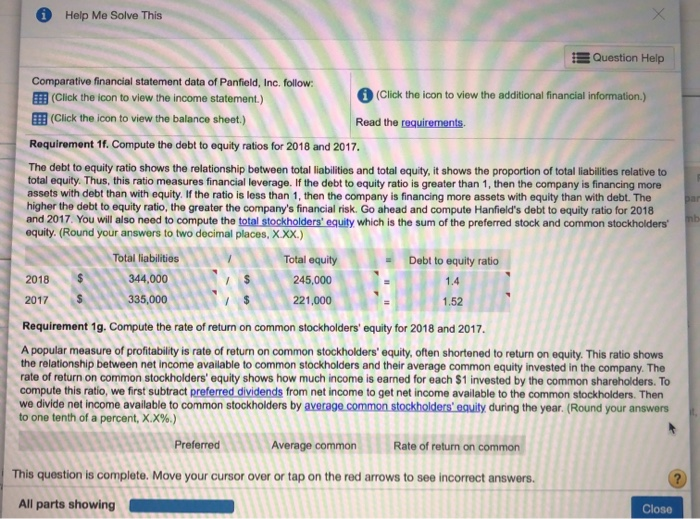
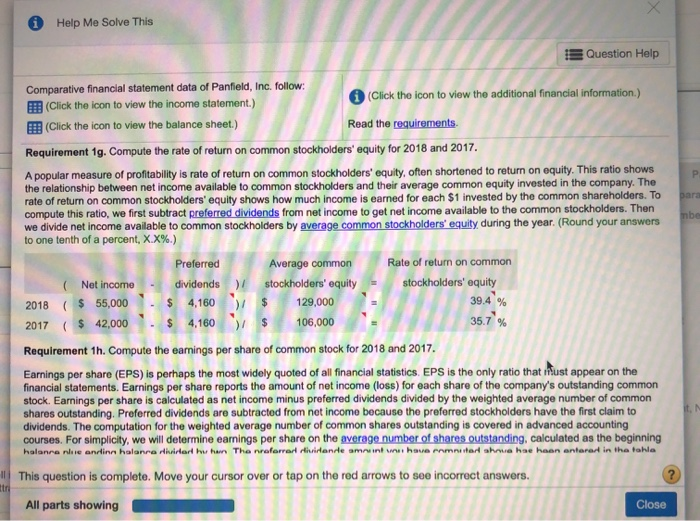
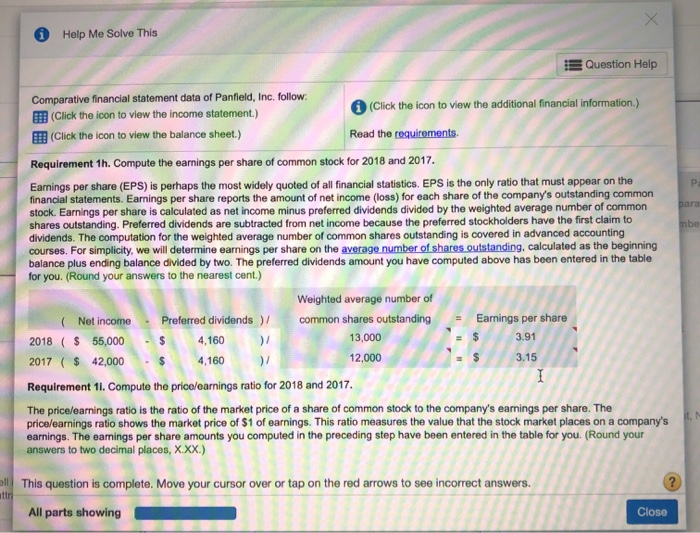
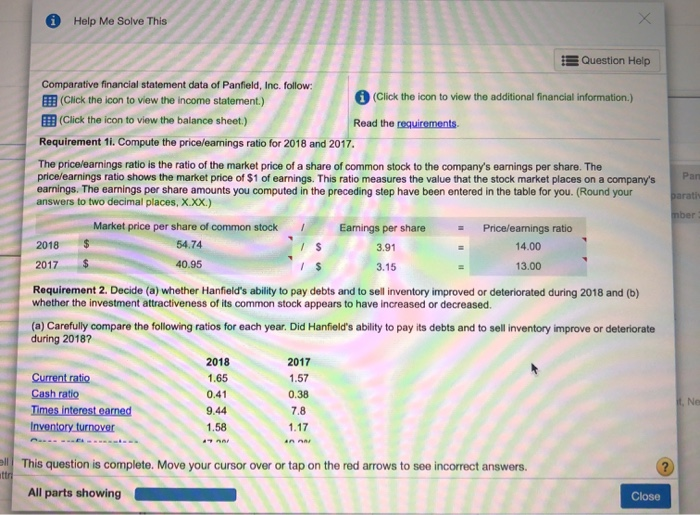
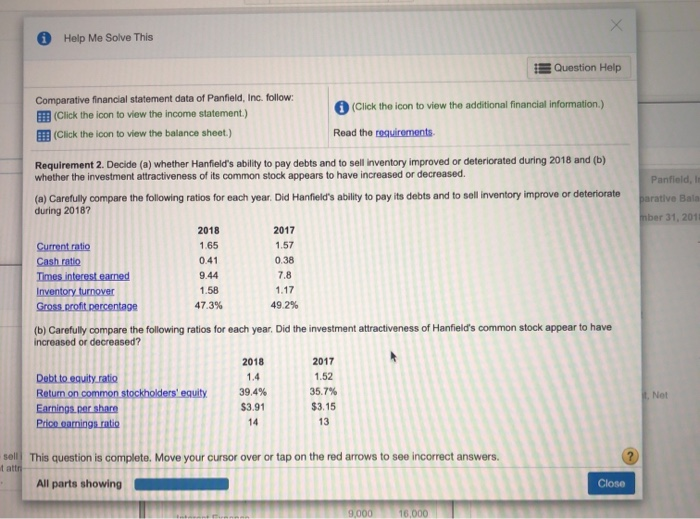
3 of 3 HW Score: 0%, 0 of 100 pts Score of 40 pts PD-34B (similar to) Command of two Additional Financial Information 1. Market price of Partaid's common stock 587.22 December 31, 20", and 4219 December 31, 2017 Common was standing: 0.00 on December 25 2011 and 1.000 on Dec 31, 2017 and 2016 Requirement to come the writer 2018 and 2017 Begin by the form to come current rate Current Done Panede Comparative Balance December 1, 2011 and 2017 2018 2010 Pequrum Income Sant 5 Cash Account Rec. Merchandi 000 1160 143300 5.000 0.000 DO 1500 100 000 200 000 DOO 1. Compute the following is for 2018 and 2017 Cash Testamente Pasteline Comparative Income Statement Total Duran Property, part and Coment, et 2013 377.000 12.00 100 S6005 570,000 550.000 1 $1.000 1.000 21100 213.000 120 2. Decide where Punta's bly to pay and to set inventory improved or deteriorated during 2018 and where were Gross Pro 5 3.000 9.000 16.00 60 2400 H00 137 152.000 $ 5.000 33.000 Stockhoden bu Choose from and down and then click here Total band 19 remaining Done 3 of 3 (0 complete) Help Me Solve This Question Help Comparative financial statement data of Panfield, Inc. follow: (Click the icon to view the income statement.) (Click the icon to view the balance sheet.) (Click the icon to view the additional financial information.) Read the requirements Panfield, parative Bal inber 31, 20 1 2018 Requirement 1a. Compute the current ratios for 2018 and 2017. The most widely used ratio is the current ratio, which is calculated as the total current assets divided by total current liabilities. The current ratio measures a company's ability to pay its current liabilities with its current assets. Refer to the information provided and calculate the current ratios for 2018 and 2017. (Round your answers to two decimal places, X.XX.) Total current assets Total current liabilities Current ratio $ 377,000 1$ 228,000 1.65 2017 $ 377,000 240,000 1.57 Requirement 1b. Compute the cash ratios for 2018 and 2017. Cash is an important part of every business. Without an adequate supply of available cash, businesses cannot continue to operate. Businesses, therefore, monitor cash very carefully. One measure that can be used to calculate a company's liquidity is the cash ratio. The cash ratio helps to determine a company's ability to meet its short-term obligations and is calculated as cash plus cash equivalents divided by total current liabilities. Notice that the cash ratio includes cash and cash equivalents. As a reminder, cash equivalents are highly liquid investments that can be converted into cash in three months or less. Refer to the information provided and calculate the cash ratio for Hanfield. (Complete all input boxes. Enter a "O" for items with a zero value. Round your answers to two decimal places, X.XX.) ( Cash Cash equivalents Total current liabilities Cash ratio 1 S 94.000 22 0.41 Net 2018 0 to sell This question is complete. Move your cursor over or tap on the red arrows to see incorrect answers. ent att d. All parts showing Close Interest Expense 9.000 16,000 Help Me Solve This Cash ratio 2017 0 Question Help Comparative financial statement data of Panfield, Inc. follow: Click the icon to view the income statement.) (Click the icon to view the additional financial information.) Click the icon to view the balance sheet.) Read the requirements X.XX) Cash Cash equivalents >/ Total current liabilities = 2018 ( $ 94,000 0 >/ $ 228,000 0.41 ( $ 92,000 >/ $ 240,000 0.38 Requirement 1c. Compute the times-interest-earned ratios for 2018 and 2017. Analysts and investors use the times-interest-earned ratio to evaluate a business's ability to pay interest expense. This ratio measures the number of times earnings before interest and taxes (EBIT) can cover (pay) interest expense. This ratio is also called the interest-coverage ratio. A high times-interest-earned ratio indicates a business's ease in paying interest expense; a low ratio suggests difficulty. The times-interest-earned ratio is calculated as EBIT (Net income + Income tax expense + Intehast expense) divided by interest expense. In this problem, the income from operations is also equal to the EBIT. Thus, we will simply divide the income from operations by the interest expense to compute the times-interest-earned ratio (Round your answers to two decimal places, X.XX.) Income from operations 1 Interest expense Times-interest-earned 2018 $ 85,000 / $ 9,000 9.44 2017 $ 78,000 1$ 10,000 Requirement 1d. Compute the inventory turnover ratios for 2018 and 2017. The inventory tumover ratio measures the number of times a company sells its average level of merchandise inventory during a year. A hinh rate of war indiratae asea in callinn marrhandica invanter a Irrata indicate difficulty A value of 4 maane that the romanu This question is complete. Move your cursor over or tap on the red arrows to see incorrect answers. All parts showing Close 7.8 2 Help Me Solve This Question Help Comparative financial statement data of Panfield, Inc. follow: Click the icon to view the income statement.) (Click the icon to view the additional financial information.) (Click the icon to view the balance sheet.) Read the requirements Requirement 1d. Compute the inventory turnover ratios for 2018 and 2017. The inventory turnover ratio measures the number of times a company sells its average level of merchandise inventory during a year. A high rate of turnover indicates ease in selling merchandise inventory; a low rate indicates difficulty. A value of 4 means that the company sold its average level of merchandise inventory four times-once every three months-during the year. If the company were a seasonal company, this would be a good ratio because it would mean it turned its inventory over each season, on average. To compute inventory turnover, we divide cost of goods sold by the average merchandise inventory for the period (Round your answers to two decimal places, ..) Cost of goods sold Average merchandise inventory Inventory turnover 2018 $ 243,000 $ 154.000 1.58 2017 216,000 184,000 Requirement 16. Compute the gross profit perceitage for 2018 and 2017. Gross profit (sometimes called gross margin) is net sales minus the cost of goods sold. Merchandisers strive to increase the gross profit percentage (also called the gross margin percentage). This ratio measures the profitability of each net sales dollar above the cost of goods sold and is computed as gross profit divided by net sales revenue. The gross profit percentage is one of the most carefully watched measures of profitability. It reflects a business's ability to earn a profit on the merchandise inventory. The gross profit earned on merchandise inventory must be high enough to cover the remaining operating expenses and to eam net income. A small increase in the gross profit percentage from last year to this year may signal an important rise in income. Conversely, a small decrease from last year to this year may signal trouble. (Round your answers to one tenth of a percent, X.X%.) 1.17 . enn endle sell This question is complete. Move your cursor over or tap on the red arrows to see incorrect answers. attr All parts showing Close X Help Me Solve This Question Help Comparative financial statement data of Panfield, Inc. follow: (Click the icon to view the income statement.) (Click the icon to view the balance sheet.) (Click the icon to view the additional financial information.) Read the requirements Requirement 1e. Compute the gross profit percentage for 2018 and 2017. Gross profit (sometimes called gross margin) is net sales minus the cost of goods sold. Merchandisers strive to increase the gross profit percentage (also called the gross margin percentage). This ratio measures the profitability of each net sales dollar above the cost of goods sold and is computed as gross profit divided by net sales revenue. The gross profit percentage is one of the most carefully watched measures of profitability. It reflects a business's ability to earn a profit on the merchandise inventory. The gross profit earned on merchandise inventory must be high enough to cover the remaining operating expenses and to earn net income. A small increase in the gross profit percentage from last year to this year may signal an important rise in income. Conversely, a small decrease from last year to this year may signal trouble. (Round your answers to one tenth of a percent, X.X%.) Gross profit Net sales revenue = Gross profit percentage 2018 $ 218,000 1$ 461,000 209,000 425,000 49.2 % Requirement 11. Compute the debt to equity ratios for 2018 and 2017. The debt to equity ratio shows the relationship between total liabilities and total equity, it shows the proportion of total liabilities relative to total equity. Thus, this ratio measures financial leverage. If the debt to equity ratio is greater than 1, then the company is financing more assets with debt than with equity. If the ratio is less than 1, then the company is financing more assets with equity than with debt. The higher the debt to equity ratio, the greater the company's financial risk. Go ahead and compute Hanfield's debt to equity ratio for and 2017. You will also need to compute the total stockholders' equity which is the sum of the preferred stock and common stockholders' equity. (Round your answers to two decimal places, X.XX.) 47.3% 2017 This question is complete. Move your cursor over or tap on the red arrows to see incorrect answers. All parts showing Close Help Me Solve This Question Help Comparative financial statement data of Panfield, Inc. follow: (Click the icon to view the income statement.) (Click the icon to view the additional financial information.) (Click the icon to view the balance sheet.) Read the requirements Requirement 17. Compute the debt to equity ratios for 2018 and 2017. The debt to equity ratio shows the relationship between total liabilities and total equity, it shows the proportion of total liabilities relative to total equity. Thus, this ratio measures financial leverage. If the debt to equity ratio is greater than 1, then the company is financing more assets with debt than with equity. If the ratio is less than 1, then the company is financing more assets with equity than with debt. The higher the debt to equity ratio, the greater the company's financial risk. Go ahead and compute Hanfield's debt to equity ratio for 2018 and 2017. You will also need to compute the total stockholders' equity which is the sum of the preferred stock and common stockholders equity. (Round your answers to two decimal places, X.XX.) Total liabilities Total equity Debt to equity ratio 2018 344,000 245,000 1.4 2017 335,000 221,000 1.52 Requirement 1g. Compute the rate of return on common stockholders' equity for 2018 and 2017. A popular measure of profitability is rate of return on common stockholders' equity, often shortened to return on equity. This ratio shows the relationship between net income available to common stockholders and their average common equity invested in the company. The rate of return on common stockholders' equity shows how much income is earned for each $1 invested by the common shareholders. To compute this ratio, we first subtract preferred dividends from net income to get net income available to the common stockholders. Then we divide net income available to common stockholders by average common stockholders' equity during the year. (Round your answers to one tenth of a percent, X.X%.) Average common Rate of return on common This question is complete. Move your cursor over or tap on the red arrows to see incorrect answers. All parts showing Close Preferred X Help Me Solve This Question Help P para mbe Comparative financial statement data of Panfield, Inc. follow: (Click the icon to view the income statement.) (Click the icon to view the additional financial information.) (Click the icon to view the balance sheet.) Read the requirements Requirement 1g. Compute the rate of return on common stockholders' equity for 2018 and 2017. A popular measure of profitability is rate of return on common stockholders' equity, often shortened to return on equity. This ratio shows the relationship between net income available to common stockholders and their average common equity invested in the company. The rate of return on common stockholders' equity shows how much income is earned for each $1 invested by the common shareholders. To compute this ratio, we first subtract preferred dividends from net income to get net income available to the common stockholders. Then we divide net income available to common stockholders by average common stockholders' equity during the year. (Round your answers to one tenth of a percent, X.X%.) Preferred Average common Rate of return on common (Net income dividends) stockholders' equity stockholders' equity 2018 ( $ 55,000 $ 4,160 / $ 129,000 39.4 % 2017 ($ 42,000 $ 4,160 >$ 106,000 Requirement 1h. Compute the earnings per share of common stock for 2018 and 2017. Earnings per share (EPS) is perhaps the most widely quoted of all financial statistics. EPS is the only ratio that must appear on the financial statements. Earnings per share reports the amount of net income (loss) for each share of the company's outstanding common stock. Earnings per share is calculated as net income minus preferred dividends divided by the weighted average number of common shares outstanding, Preferred dividends are subtracted from net income because the preferred stockholders have the first claim to dividends. The computation for the weighted average number of common shares outstanding is covered in advanced accounting courses. For simplicity, we will determine earnings per share on the average number of shares outstanding, calculated as the beginning halanranle andinn halanra rivistar whan Tha nafarra dividande amount have mar shrua hae haan antarart in the follo This question is complete. Move your cursor over or tap on the red arrows to see incorrect answers. All parts showing Close 35.7 % it. tr Help Me Solve This Question Help P para be Comparative financial statement data of Panfield, Inc. follow: (Click the icon to view the income statement.) (Click the icon to view the additional financial information.) (Click the icon to view the balance sheet.) Read the requirements. Requirement 1h. Compute the earnings per share of common stock for 2018 and 2017. Earnings per share (EPS) is perhaps the most widely quoted of all financial statistics. EPS is the only ratio that must appear on the financial statements. Earnings per share reports the amount of net income (loss) for each share of the company's outstanding common stock. Earnings per share is calculated as net income minus preferred dividends divided by the weighted average number of common shares outstanding. Preferred dividends are subtracted from net income because the preferred stockholders have the first claim to dividends. The computation for the weighted average number of common shares outstanding is covered in advanced accounting courses. For simplicity, we will determine earnings per share on the average number of shares outstanding, calculated as the beginning balance plus ending balance divided by two. The preferred dividends amount you have computed above has been entered in the table for you. (Round your answers to the nearest cent.) Weighted average number of (Net income Preferred dividends ) / common shares outstanding Earnings per share 2018 ( $ 55,000 - $ 4,160 13,000 $ 3.91 2017 ( $ 42,000 4,160 )/ 12,000 $ 3.15 Requirement 11. Compute the price/earnings ratio for 2018 and 2017. I The price/earnings ratio is the ratio of the market price of a share of common stock to the company's earnings per share. The price/earnings ratio shows the market price of $1 of earnings. This ratio measures the value that the stock market places on a company's earnings. The earnings per share amounts you computed in the preceding step have been entered in the table for you. (Round your answers to two decimal places, X.XX.) all This question is complete. Move your cursor over or tap on the red arrows to see incorrect answers. Attri All parts showing Close Help Me Solve This Pan parati mber Question Help Comparative financial statement data of Panfield, Inc. follow: (Click the icon to view the income statement.) (Click the icon to view the additional financial information.) (Click the icon to view the balance sheet.) Read the requirements Requirement 11. Compute the price/earnings ratio for 2018 and 2017. The price/earnings ratio is the ratio of the market price of a share of common stock to the company's earnings per share. The price/earnings ratio shows the market price of $1 of earnings. This ratio measures the value that the stock market places on a company's earnings. The earnings per share amounts you computed in the preceding step have been entered in the table for you. (Round your answers to two decimal places, X.XX.) Market price per share of common stock Eamings per share Pricelearnings ratio 54.74 3.91 14.00 40.95 3.15 13.00 Requirement 2. Decide (a) whether Hanfield's ability to pay debts and to sell inventory improved or deteriorated during 2018 and (b) whether the investment attractiveness of its common stock appears to have increased or decreased. (a) Carefully compare the following ratios for each year. Did Hanfield's ability to pay its debts and to sell inventory improve or deteriorate during 2018? 2018 2017 Current ratio 1.65 1.57 Cash ratio 0.41 0.38 Times interest earned Inventory turnover 1.58 2018 $ 2017 it. No 9.44 7.8 1.17 AN AM This question is complete. Move your cursor over or tap on the red arrows to see incorrect answers. ? All parts showing Close Help Me Solve This Question Help Comparative financial statement data of Panfield, Inc. follow: (Click the icon to view the income statement.) (Click the icon to view the additional financial information.) Click the icon to view the balance sheet.) Read the requirements Requirement 2. Decide (a) whether Hanfield's ability to pay debts and to sell inventory improved or deteriorated during 2018 and (b) whether the investment attractiveness of its common stock appears to have increased or decreased. (a) Carefully compare the following ratios for each year. Did Hanfield's ability to pay its debts and to sell inventory improve or deteriorate during 20187 Panfield, parative Balo mber 31, 201 2018 2017 Current ratio 1.65 1.57 Cash ratio 0.41 0.38 Times interest earned 9.44 7.8 Inventory turnover 1.58 1.17 Grosscroft percentage 47.3% 49.2% (b) Carefully compare the following ratios for each year, Did the investment attractiveness of Hanfield's common stock appear to have increased or decreased? 2018 2017 Debt to equity ratio 1.4 1.52 Return on common stockholders' equity 39.4% 35.7% Earnings.per Share $3.91 $3.15 Price earnings ratio 14 13 Not sell This question is complete. Move your cursor over or tap on the red arrows to see incorrect answers. tatt - All parts showing Close 9,000 16,000 3 of 3 HW Score: 0%, 0 of 100 pts Score of 40 pts PD-34B (similar to) Command of two Additional Financial Information 1. Market price of Partaid's common stock 587.22 December 31, 20", and 4219 December 31, 2017 Common was standing: 0.00 on December 25 2011 and 1.000 on Dec 31, 2017 and 2016 Requirement to come the writer 2018 and 2017 Begin by the form to come current rate Current Done Panede Comparative Balance December 1, 2011 and 2017 2018 2010 Pequrum Income Sant 5 Cash Account Rec. Merchandi 000 1160 143300 5.000 0.000 DO 1500 100 000 200 000 DOO 1. Compute the following is for 2018 and 2017 Cash Testamente Pasteline Comparative Income Statement Total Duran Property, part and Coment, et 2013 377.000 12.00 100 S6005 570,000 550.000 1 $1.000 1.000 21100 213.000 120 2. Decide where Punta's bly to pay and to set inventory improved or deteriorated during 2018 and where were Gross Pro 5 3.000 9.000 16.00 60 2400 H00 137 152.000 $ 5.000 33.000 Stockhoden bu Choose from and down and then click here Total band 19 remaining Done 3 of 3 (0 complete) Help Me Solve This Question Help Comparative financial statement data of Panfield, Inc. follow: (Click the icon to view the income statement.) (Click the icon to view the balance sheet.) (Click the icon to view the additional financial information.) Read the requirements Panfield, parative Bal inber 31, 20 1 2018 Requirement 1a. Compute the current ratios for 2018 and 2017. The most widely used ratio is the current ratio, which is calculated as the total current assets divided by total current liabilities. The current ratio measures a company's ability to pay its current liabilities with its current assets. Refer to the information provided and calculate the current ratios for 2018 and 2017. (Round your answers to two decimal places, X.XX.) Total current assets Total current liabilities Current ratio $ 377,000 1$ 228,000 1.65 2017 $ 377,000 240,000 1.57 Requirement 1b. Compute the cash ratios for 2018 and 2017. Cash is an important part of every business. Without an adequate supply of available cash, businesses cannot continue to operate. Businesses, therefore, monitor cash very carefully. One measure that can be used to calculate a company's liquidity is the cash ratio. The cash ratio helps to determine a company's ability to meet its short-term obligations and is calculated as cash plus cash equivalents divided by total current liabilities. Notice that the cash ratio includes cash and cash equivalents. As a reminder, cash equivalents are highly liquid investments that can be converted into cash in three months or less. Refer to the information provided and calculate the cash ratio for Hanfield. (Complete all input boxes. Enter a "O" for items with a zero value. Round your answers to two decimal places, X.XX.) ( Cash Cash equivalents Total current liabilities Cash ratio 1 S 94.000 22 0.41 Net 2018 0 to sell This question is complete. Move your cursor over or tap on the red arrows to see incorrect answers. ent att d. All parts showing Close Interest Expense 9.000 16,000 Help Me Solve This Cash ratio 2017 0 Question Help Comparative financial statement data of Panfield, Inc. follow: Click the icon to view the income statement.) (Click the icon to view the additional financial information.) Click the icon to view the balance sheet.) Read the requirements X.XX) Cash Cash equivalents >/ Total current liabilities = 2018 ( $ 94,000 0 >/ $ 228,000 0.41 ( $ 92,000 >/ $ 240,000 0.38 Requirement 1c. Compute the times-interest-earned ratios for 2018 and 2017. Analysts and investors use the times-interest-earned ratio to evaluate a business's ability to pay interest expense. This ratio measures the number of times earnings before interest and taxes (EBIT) can cover (pay) interest expense. This ratio is also called the interest-coverage ratio. A high times-interest-earned ratio indicates a business's ease in paying interest expense; a low ratio suggests difficulty. The times-interest-earned ratio is calculated as EBIT (Net income + Income tax expense + Intehast expense) divided by interest expense. In this problem, the income from operations is also equal to the EBIT. Thus, we will simply divide the income from operations by the interest expense to compute the times-interest-earned ratio (Round your answers to two decimal places, X.XX.) Income from operations 1 Interest expense Times-interest-earned 2018 $ 85,000 / $ 9,000 9.44 2017 $ 78,000 1$ 10,000 Requirement 1d. Compute the inventory turnover ratios for 2018 and 2017. The inventory tumover ratio measures the number of times a company sells its average level of merchandise inventory during a year. A hinh rate of war indiratae asea in callinn marrhandica invanter a Irrata indicate difficulty A value of 4 maane that the romanu This question is complete. Move your cursor over or tap on the red arrows to see incorrect answers. All parts showing Close 7.8 2 Help Me Solve This Question Help Comparative financial statement data of Panfield, Inc. follow: Click the icon to view the income statement.) (Click the icon to view the additional financial information.) (Click the icon to view the balance sheet.) Read the requirements Requirement 1d. Compute the inventory turnover ratios for 2018 and 2017. The inventory turnover ratio measures the number of times a company sells its average level of merchandise inventory during a year. A high rate of turnover indicates ease in selling merchandise inventory; a low rate indicates difficulty. A value of 4 means that the company sold its average level of merchandise inventory four times-once every three months-during the year. If the company were a seasonal company, this would be a good ratio because it would mean it turned its inventory over each season, on average. To compute inventory turnover, we divide cost of goods sold by the average merchandise inventory for the period (Round your answers to two decimal places, ..) Cost of goods sold Average merchandise inventory Inventory turnover 2018 $ 243,000 $ 154.000 1.58 2017 216,000 184,000 Requirement 16. Compute the gross profit perceitage for 2018 and 2017. Gross profit (sometimes called gross margin) is net sales minus the cost of goods sold. Merchandisers strive to increase the gross profit percentage (also called the gross margin percentage). This ratio measures the profitability of each net sales dollar above the cost of goods sold and is computed as gross profit divided by net sales revenue. The gross profit percentage is one of the most carefully watched measures of profitability. It reflects a business's ability to earn a profit on the merchandise inventory. The gross profit earned on merchandise inventory must be high enough to cover the remaining operating expenses and to eam net income. A small increase in the gross profit percentage from last year to this year may signal an important rise in income. Conversely, a small decrease from last year to this year may signal trouble. (Round your answers to one tenth of a percent, X.X%.) 1.17 . enn endle sell This question is complete. Move your cursor over or tap on the red arrows to see incorrect answers. attr All parts showing Close X Help Me Solve This Question Help Comparative financial statement data of Panfield, Inc. follow: (Click the icon to view the income statement.) (Click the icon to view the balance sheet.) (Click the icon to view the additional financial information.) Read the requirements Requirement 1e. Compute the gross profit percentage for 2018 and 2017. Gross profit (sometimes called gross margin) is net sales minus the cost of goods sold. Merchandisers strive to increase the gross profit percentage (also called the gross margin percentage). This ratio measures the profitability of each net sales dollar above the cost of goods sold and is computed as gross profit divided by net sales revenue. The gross profit percentage is one of the most carefully watched measures of profitability. It reflects a business's ability to earn a profit on the merchandise inventory. The gross profit earned on merchandise inventory must be high enough to cover the remaining operating expenses and to earn net income. A small increase in the gross profit percentage from last year to this year may signal an important rise in income. Conversely, a small decrease from last year to this year may signal trouble. (Round your answers to one tenth of a percent, X.X%.) Gross profit Net sales revenue = Gross profit percentage 2018 $ 218,000 1$ 461,000 209,000 425,000 49.2 % Requirement 11. Compute the debt to equity ratios for 2018 and 2017. The debt to equity ratio shows the relationship between total liabilities and total equity, it shows the proportion of total liabilities relative to total equity. Thus, this ratio measures financial leverage. If the debt to equity ratio is greater than 1, then the company is financing more assets with debt than with equity. If the ratio is less than 1, then the company is financing more assets with equity than with debt. The higher the debt to equity ratio, the greater the company's financial risk. Go ahead and compute Hanfield's debt to equity ratio for and 2017. You will also need to compute the total stockholders' equity which is the sum of the preferred stock and common stockholders' equity. (Round your answers to two decimal places, X.XX.) 47.3% 2017 This question is complete. Move your cursor over or tap on the red arrows to see incorrect answers. All parts showing Close Help Me Solve This Question Help Comparative financial statement data of Panfield, Inc. follow: (Click the icon to view the income statement.) (Click the icon to view the additional financial information.) (Click the icon to view the balance sheet.) Read the requirements Requirement 17. Compute the debt to equity ratios for 2018 and 2017. The debt to equity ratio shows the relationship between total liabilities and total equity, it shows the proportion of total liabilities relative to total equity. Thus, this ratio measures financial leverage. If the debt to equity ratio is greater than 1, then the company is financing more assets with debt than with equity. If the ratio is less than 1, then the company is financing more assets with equity than with debt. The higher the debt to equity ratio, the greater the company's financial risk. Go ahead and compute Hanfield's debt to equity ratio for 2018 and 2017. You will also need to compute the total stockholders' equity which is the sum of the preferred stock and common stockholders equity. (Round your answers to two decimal places, X.XX.) Total liabilities Total equity Debt to equity ratio 2018 344,000 245,000 1.4 2017 335,000 221,000 1.52 Requirement 1g. Compute the rate of return on common stockholders' equity for 2018 and 2017. A popular measure of profitability is rate of return on common stockholders' equity, often shortened to return on equity. This ratio shows the relationship between net income available to common stockholders and their average common equity invested in the company. The rate of return on common stockholders' equity shows how much income is earned for each $1 invested by the common shareholders. To compute this ratio, we first subtract preferred dividends from net income to get net income available to the common stockholders. Then we divide net income available to common stockholders by average common stockholders' equity during the year. (Round your answers to one tenth of a percent, X.X%.) Average common Rate of return on common This question is complete. Move your cursor over or tap on the red arrows to see incorrect answers. All parts showing Close Preferred X Help Me Solve This Question Help P para mbe Comparative financial statement data of Panfield, Inc. follow: (Click the icon to view the income statement.) (Click the icon to view the additional financial information.) (Click the icon to view the balance sheet.) Read the requirements Requirement 1g. Compute the rate of return on common stockholders' equity for 2018 and 2017. A popular measure of profitability is rate of return on common stockholders' equity, often shortened to return on equity. This ratio shows the relationship between net income available to common stockholders and their average common equity invested in the company. The rate of return on common stockholders' equity shows how much income is earned for each $1 invested by the common shareholders. To compute this ratio, we first subtract preferred dividends from net income to get net income available to the common stockholders. Then we divide net income available to common stockholders by average common stockholders' equity during the year. (Round your answers to one tenth of a percent, X.X%.) Preferred Average common Rate of return on common (Net income dividends) stockholders' equity stockholders' equity 2018 ( $ 55,000 $ 4,160 / $ 129,000 39.4 % 2017 ($ 42,000 $ 4,160 >$ 106,000 Requirement 1h. Compute the earnings per share of common stock for 2018 and 2017. Earnings per share (EPS) is perhaps the most widely quoted of all financial statistics. EPS is the only ratio that must appear on the financial statements. Earnings per share reports the amount of net income (loss) for each share of the company's outstanding common stock. Earnings per share is calculated as net income minus preferred dividends divided by the weighted average number of common shares outstanding, Preferred dividends are subtracted from net income because the preferred stockholders have the first claim to dividends. The computation for the weighted average number of common shares outstanding is covered in advanced accounting courses. For simplicity, we will determine earnings per share on the average number of shares outstanding, calculated as the beginning halanranle andinn halanra rivistar whan Tha nafarra dividande amount have mar shrua hae haan antarart in the follo This question is complete. Move your cursor over or tap on the red arrows to see incorrect answers. All parts showing Close 35.7 % it. tr Help Me Solve This Question Help P para be Comparative financial statement data of Panfield, Inc. follow: (Click the icon to view the income statement.) (Click the icon to view the additional financial information.) (Click the icon to view the balance sheet.) Read the requirements. Requirement 1h. Compute the earnings per share of common stock for 2018 and 2017. Earnings per share (EPS) is perhaps the most widely quoted of all financial statistics. EPS is the only ratio that must appear on the financial statements. Earnings per share reports the amount of net income (loss) for each share of the company's outstanding common stock. Earnings per share is calculated as net income minus preferred dividends divided by the weighted average number of common shares outstanding. Preferred dividends are subtracted from net income because the preferred stockholders have the first claim to dividends. The computation for the weighted average number of common shares outstanding is covered in advanced accounting courses. For simplicity, we will determine earnings per share on the average number of shares outstanding, calculated as the beginning balance plus ending balance divided by two. The preferred dividends amount you have computed above has been entered in the table for you. (Round your answers to the nearest cent.) Weighted average number of (Net income Preferred dividends ) / common shares outstanding Earnings per share 2018 ( $ 55,000 - $ 4,160 13,000 $ 3.91 2017 ( $ 42,000 4,160 )/ 12,000 $ 3.15 Requirement 11. Compute the price/earnings ratio for 2018 and 2017. I The price/earnings ratio is the ratio of the market price of a share of common stock to the company's earnings per share. The price/earnings ratio shows the market price of $1 of earnings. This ratio measures the value that the stock market places on a company's earnings. The earnings per share amounts you computed in the preceding step have been entered in the table for you. (Round your answers to two decimal places, X.XX.) all This question is complete. Move your cursor over or tap on the red arrows to see incorrect answers. Attri All parts showing Close Help Me Solve This Pan parati mber Question Help Comparative financial statement data of Panfield, Inc. follow: (Click the icon to view the income statement.) (Click the icon to view the additional financial information.) (Click the icon to view the balance sheet.) Read the requirements Requirement 11. Compute the price/earnings ratio for 2018 and 2017. The price/earnings ratio is the ratio of the market price of a share of common stock to the company's earnings per share. The price/earnings ratio shows the market price of $1 of earnings. This ratio measures the value that the stock market places on a company's earnings. The earnings per share amounts you computed in the preceding step have been entered in the table for you. (Round your answers to two decimal places, X.XX.) Market price per share of common stock Eamings per share Pricelearnings ratio 54.74 3.91 14.00 40.95 3.15 13.00 Requirement 2. Decide (a) whether Hanfield's ability to pay debts and to sell inventory improved or deteriorated during 2018 and (b) whether the investment attractiveness of its common stock appears to have increased or decreased. (a) Carefully compare the following ratios for each year. Did Hanfield's ability to pay its debts and to sell inventory improve or deteriorate during 2018? 2018 2017 Current ratio 1.65 1.57 Cash ratio 0.41 0.38 Times interest earned Inventory turnover 1.58 2018 $ 2017 it. No 9.44 7.8 1.17 AN AM This question is complete. Move your cursor over or tap on the red arrows to see incorrect answers. ? All parts showing Close Help Me Solve This Question Help Comparative financial statement data of Panfield, Inc. follow: (Click the icon to view the income statement.) (Click the icon to view the additional financial information.) Click the icon to view the balance sheet.) Read the requirements Requirement 2. Decide (a) whether Hanfield's ability to pay debts and to sell inventory improved or deteriorated during 2018 and (b) whether the investment attractiveness of its common stock appears to have increased or decreased. (a) Carefully compare the following ratios for each year. Did Hanfield's ability to pay its debts and to sell inventory improve or deteriorate during 20187 Panfield, parative Balo mber 31, 201 2018 2017 Current ratio 1.65 1.57 Cash ratio 0.41 0.38 Times interest earned 9.44 7.8 Inventory turnover 1.58 1.17 Grosscroft percentage 47.3% 49.2% (b) Carefully compare the following ratios for each year, Did the investment attractiveness of Hanfield's common stock appear to have increased or decreased? 2018 2017 Debt to equity ratio 1.4 1.52 Return on common stockholders' equity 39.4% 35.7% Earnings.per Share $3.91 $3.15 Price earnings ratio 14 13 Not sell This question is complete. Move your cursor over or tap on the red arrows to see incorrect answers. tatt - All parts showing Close 9,000 16,000 the other photos are a example of the problem and how it should be done and format the numbers are diffrent
Step by Step Solution
There are 3 Steps involved in it
Step: 1

Get Instant Access to Expert-Tailored Solutions
See step-by-step solutions with expert insights and AI powered tools for academic success
Step: 2

Step: 3
Ace Your Homework with AI
Get the answers you need in no time with our AI-driven, step-by-step assistance
Get Started
Study Guide To Accompany Financial Accounting In An Economic Context
Authors: Jamie Pratt
6th Edition
0471731110, 978-0471731115