for monday please!!!! fin 357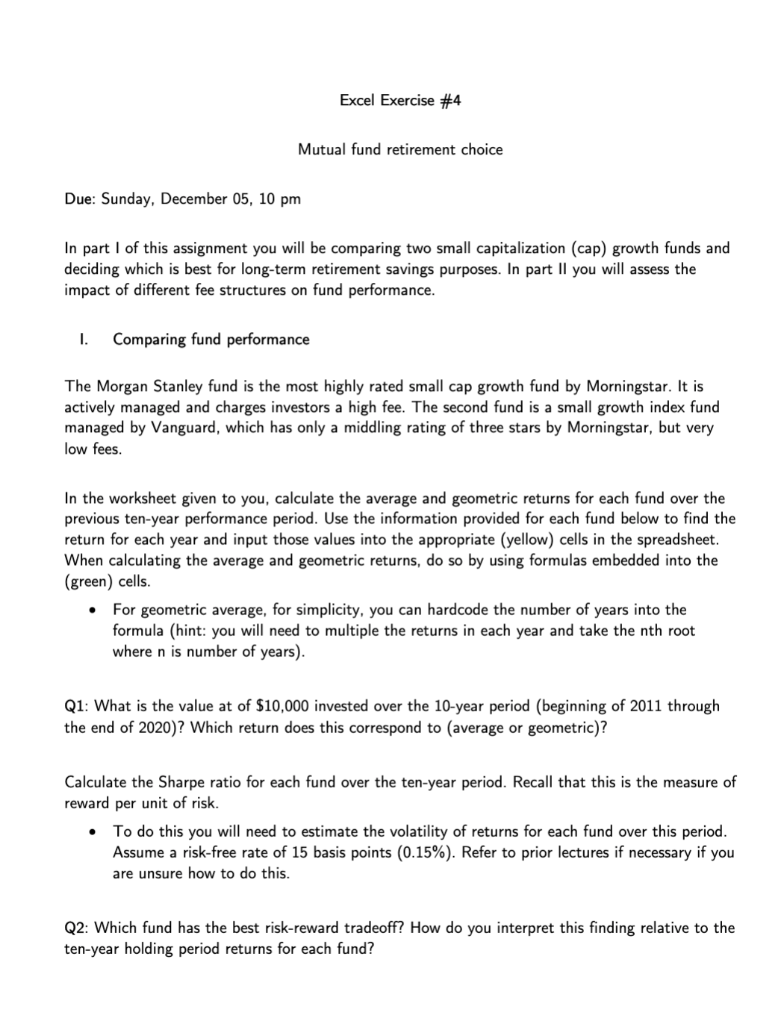
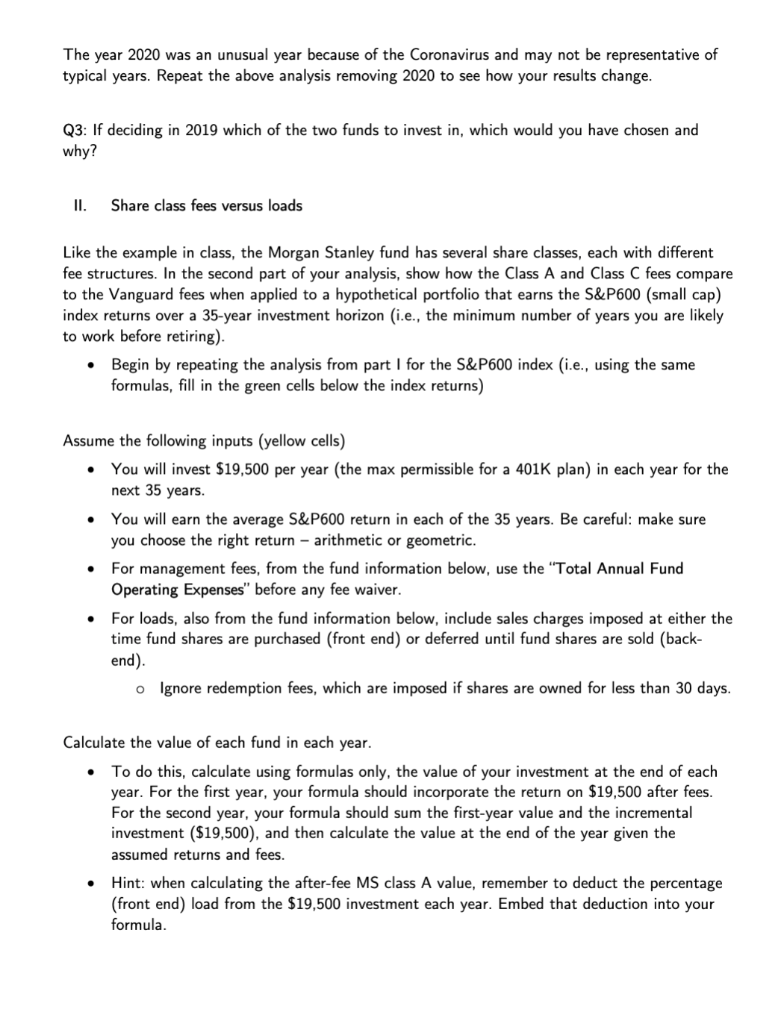
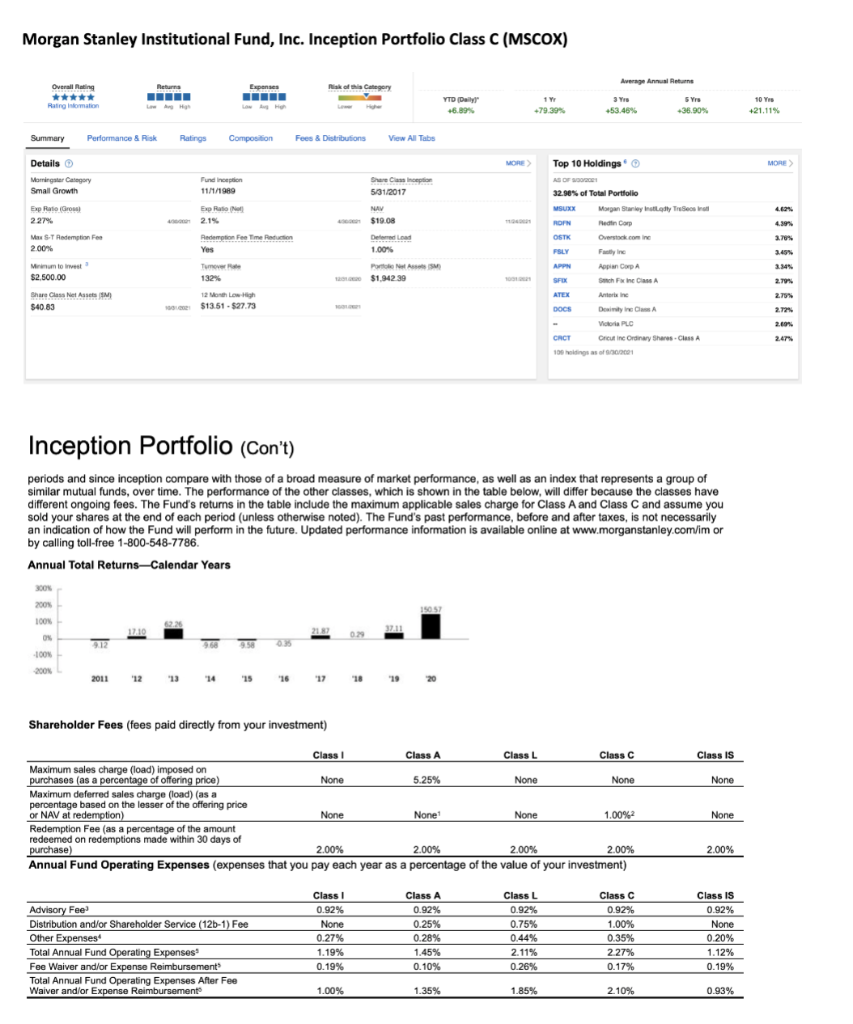
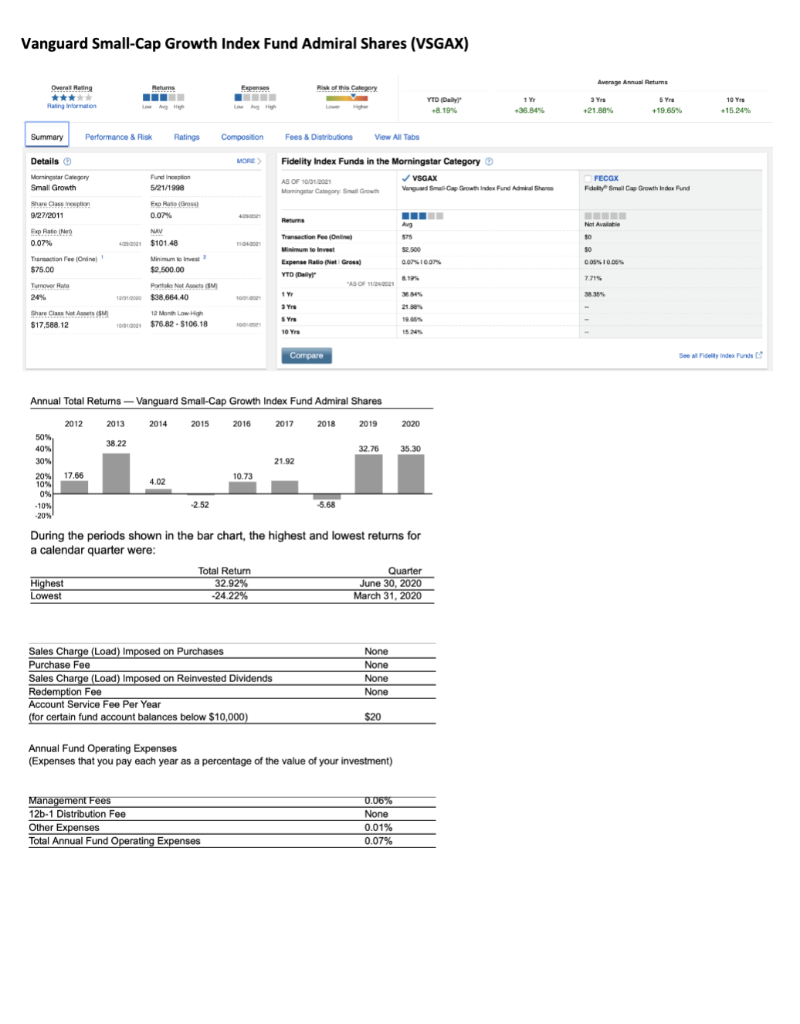
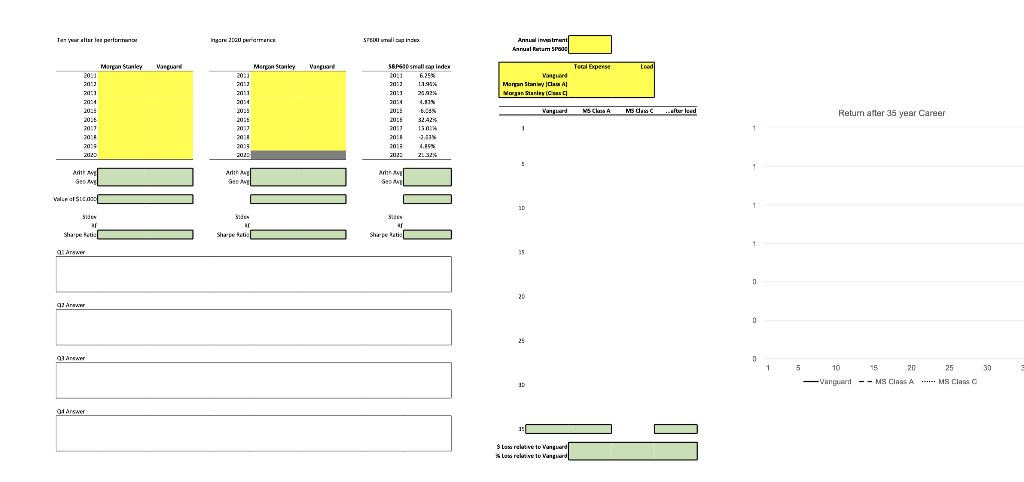
Excel Exercise #4 Mutual fund retirement choice Due: Sunday, December 05, 10 pm In part I of this assignment you will be comparing two small capitalization (cap) growth funds and deciding which is best for long-term retirement savings purposes. In part II you will assess the impact of different fee structures on fund performance. I. Comparing fund performance The Morgan Stanley fund is the most highly rated small cap growth fund by Morningstar. It is actively managed and charges investors a high fee. The second fund is a small growth index fund managed by Vanguard, which has only a middling rating of three stars by Morningstar, but very low fees. In the worksheet given to you, calculate the average and geometric returns for each fund over the previous ten-year performance period. Use the information provided for each fund below to find the return for each year and input those values into the appropriate (yellow) cells in the spreadsheet. When calculating the average and geometric returns, do so by using formulas embedded into the (green) cells. For geometric average, for simplicity, you can hardcode the number of years into the formula (hint: you will need to multiple the returns in each year and take the nth root where n is number of years). . Q1: What is the value at of $10,000 invested over the 10-year period (beginning of 2011 through the end of 2020)? Which return does this correspond to (average or geometric)? Calculate the Sharpe ratio for each fund over the ten-year period. Recall that this is the measure of reward per unit of risk. To do this you will need to estimate the volatility of returns for each fund over this period. Assume a risk-free rate of 15 basis points (0.15%). Refer to prior lectures if necessary if you how to do this. . are Q2: Which fund has the best risk-reward tradeoff? How do you interpret this finding relative to the ten-year holding period returns for each fund? The year 2020 was an unusual year because of the Coronavirus and may not be representative of typical years. Repeat the above analysis removing 2020 to see how your results change. Q3: If deciding in 2019 which of the two funds to invest in, which would you have chosen and why? II. Share class fees versus loads Like the example in class, the Morgan Stanley fund has several share classes, each with different fee structures. In the second part of your analysis, show how the Class A and Class C fees compare to the Vanguard fees when applied to a hypothetical portfolio that earns the S&P600 (small cap) index returns over a 35-year investment horizon (i.e., the minimum number of years you are likely to work before retiring). Begin by repeating the analysis from part I for the S&P600 index (i.e., using the same formulas, fill in the green cells below the index returns) . . Assume the following inputs (yellow cells) You will invest $19,500 per year (the max permissible for a 401k plan) in each year for the next 35 years. You will earn the average S&P600 return in each of the 35 years. Be careful: make sure you choose the right return - arithmetic or geometric. For management fees, from the fund information below, use the "Total Annual Fund Operating Expenses" before any fee waiver. For loads, also from the fund information below, include sales charges imposed at either the time fund shares are purchased (front end) or deferred until fund shares are sold (back- end). o Ignore redemption fees, which are imposed if shares are owned for less than 30 days. . Calculate the value of each fund in each year. To do this, calculate using formulas only, the value of your investment at the end of each year. For the first year, your formula should incorporate the return on $19,500 after fees. For the second year, your formula should sum the first-year value and the incremental investment ($19,500), and then calculate the value at the end of the year given the assumed returns and fees. Hint: when calculating the after-fee MS class A value, remember to deduct the percentage (front end) load from the $19,500 investment each year. Embed that deduction into your formula. . . Hint: when calculating the after-fee MS class C value, do it in two parts. In the third column, ignore the load. In the fourth column, simply deduct the load percentage in each year. Q4: (green cells) What is the value of each fund in year 35? What is the dollar difference in ending fund values between the Vanguard fees and MS fees? What is the percent difference? (box) Explain which MS share class is better and why. Morgan Stanley Institutional Fund, Inc. Inception Portfolio Class C (MSCOX) Average Annual Returns Return Expenses Nisk of Category Overall Rating ***** Rating intormation YTD Daily +6,89% 1 Y -79.39% 3Y +53.46% 5 Yrs 36.90% 10 yrs 21.11% Summary Performance & Risk Ratings Composition Fees & Distributions View All Tabs MORE > MORE Details Morningstar Cangry Small Growth Fundinception 11/1/199 4. Exp Rato Gros 227 4.39 Expo 2.15 Redemption Fee Time Yes Share Casino 531/2017 NAV $19.08 Der 1.00% PAS $1.942 39 MS.TRedemption Fee 2.00% Top 10 Holdings AS OF 32.90% of Total Portfolio MSUXX Morgan Stanley Trees RON Pet Cor OSTK Overstock.com PSLY Flyine APPH Appia Corp SFX Sench Farine Class A ATEX Aine DOCS Deimily reas Victor PL CRCT Cricut in Ordinay Shares-Class A 100 ildings of Monument $2.500.00 Tumor 132% 3.70% 3.45% 3.34% 2.79% 2.70 Share Classes $40.83 12 Mon Low $13.51 - $27.73 2.72% 2009 2.4 Inception Portfolio (Con't) periods and since inception compare with those of a broad measure of market performance, as well as an index that represents a group of similar mutual funds, over time. The performance of the other classes, which is shown in the table below, will differ because the classes have different ongoing fees. The Fund's returns in the table include the maximum applicable sales charge for Class A and Class C and assume you sold your shares at the end of each period (unless otherwise noted). The Fund's past performance, before and after taxes, is not necessarily an indication of how the Fund will perform in the future. Updated performance information is available online at www.morganstanley.com/im or by calling toll-free 1-800-548-7786. Annual Total Returns-Calendar Years 300 150 100% 12210 217 2711 0 09 9.50 0335 -100 2005 2011 '12 13 "14 "15 '16 "17 '18 Shareholder Fees (fees paid directly from your investment) Class Is None Classi Class A A Class L Class C C Maximum sales charge (load) imposed on purchases (as a percentage of offering price) None 5.25% None None Maximum deferred sales charge (load) (as a percentage based on the lesser of the offering price or NAV at redemption) None None None 1.00% Redemption Fee (as a percentage of the amount redeemed on redemptions made within 30 days of purchase) 2.00% 2.00% 2.00% 2.00% % Annual Fund Operating Expenses (expenses that you pay each year as a percentage of the value of your investment) None 2.00% Advisory Feed Distribution and/or Shareholder Service (12b-1) Fee /) Other Expenses Total Annual Fund Operating Expenses Fee Waiver and/or Expense Reimbursement Total Annual Fund Operating Expenses After Fee Waiver andlor Expense Reimbursement Class 1 0.92% None 0.27% 1.19% 0.19% Class A 0.92% 0.25% 0.28% 1.45% 0.10% Class 0.92% 0.75% 0.44% 2.11% 0.26% Class C 0.92% 1.00% 0.35% 2.27% 0.17% Class Is 0.92% None 0.20% 1.12% 0.19% 1.00% 1.35% 1.85% 2.10% 0.93% Vanguard Small-Cap Growth Index Fund Admiral Shares (VSGAX) Average Amatuma Returns Risk of this Category *** Rating on 3Y 10 Y YTD Daily .8.19% 1 36.84% 5 Yra +19.65% Summary Performance & Risk Ratings Composition Fees & Distributions View All Tabs MORE Purdin 5/21/1990 Fidelity Index Funds in the Morningstar Category AS OF 10/31/201 VSGAX Woming Cagay na Varga Small Cap Growth Index Fund Admiral Share FECGX Fidely Small Cap Growth in dosund Details Morning Ceny Small Growth Share Classroom 9/27/2011 Exp Rate 0.07 ER 0.07% NIV Thensioen 575 so 50 0010 0.074100 Thanation Fee Online $75.00 Tumowe Role 24% $101.48 Minimum $2.500.00 Porto Aanes (SM $38.664.40 7719 Expense Radio Net Gross YTDY AS OF 19 3 Yra Yra SY 10 Yrs 3.3 Shure Classe A $17.588.12 12 Month Low High $76.82 $106.18 15 Compare Seyinde 35.30 Annual Total Retums - Vanguard Small Cap Growth Index Fund Admiral Shares 2012 2013 2014 2015 2016 2017 2018 2019 2020 50% 40% % 38.22 32.76 30% 21.92 20% 17.66 10.73 10% 4.02 0% -10% 2.52 5.68 -20% During the periods shown in the bar chart, the highest and lowest returns for a calendar quarter were: Total Return Quarter Highest 32.92% June 30, 2020 Lowest -24.22% March 31, 2020 Sales Charge (Load) Imposed on Purchases Purchase Fee Sales Charge (Load) Imposed on Reinvested Dividends Redemption Fee Account Service Fee Per Year (for certain fund account balances below $10,000) None None None None $20 Annual Fund Operating Expenses (Expenses that you pay each year as a percentage of the value of your investment) ( Management Fees 12b- 1 Distribution Fee Other Expenses Total Annual Fund Operating Expenses 0.06% None 0.01% 0.07% Ten your allar la part Ingre 2000 pericum STB in d. Annual intrat Annual Farum SP Marpon Stanley Varare Varpur Tocal Expense Lood Vanguard Marpan Stanwy Class Al Morgan Series Class Morgan Stanley 201 2013 2011 2011 20 201 2013 2018 2013 2029 58200 small copinde 2013 2013 1.1954 20:1 20.97% 2014 4.11 20:5 2016 32 A2 2017 1501 2015 -2.53 20: L.IS 202 21 32% 20:3 20:1 2014 20:5 2016 2017 2018 2018 2020 Vinard MS Class MS Chan Charles A Return after 36 year Career ar El SEDAN anth Gent Arith Gel GEDANE Vale a SIG 3D Side Sides or Sharper ar Share Sharpe 1 Araw 25 20 92 Arne 25 GARAW 1 30 10 15 20 25 -Vanguard -- MS Class AMS Class 01 ASACI Laserto Vanguard Lassento angerd Excel Exercise #4 Mutual fund retirement choice Due: Sunday, December 05, 10 pm In part I of this assignment you will be comparing two small capitalization (cap) growth funds and deciding which is best for long-term retirement savings purposes. In part II you will assess the impact of different fee structures on fund performance. I. Comparing fund performance The Morgan Stanley fund is the most highly rated small cap growth fund by Morningstar. It is actively managed and charges investors a high fee. The second fund is a small growth index fund managed by Vanguard, which has only a middling rating of three stars by Morningstar, but very low fees. In the worksheet given to you, calculate the average and geometric returns for each fund over the previous ten-year performance period. Use the information provided for each fund below to find the return for each year and input those values into the appropriate (yellow) cells in the spreadsheet. When calculating the average and geometric returns, do so by using formulas embedded into the (green) cells. For geometric average, for simplicity, you can hardcode the number of years into the formula (hint: you will need to multiple the returns in each year and take the nth root where n is number of years). . Q1: What is the value at of $10,000 invested over the 10-year period (beginning of 2011 through the end of 2020)? Which return does this correspond to (average or geometric)? Calculate the Sharpe ratio for each fund over the ten-year period. Recall that this is the measure of reward per unit of risk. To do this you will need to estimate the volatility of returns for each fund over this period. Assume a risk-free rate of 15 basis points (0.15%). Refer to prior lectures if necessary if you how to do this. . are Q2: Which fund has the best risk-reward tradeoff? How do you interpret this finding relative to the ten-year holding period returns for each fund? The year 2020 was an unusual year because of the Coronavirus and may not be representative of typical years. Repeat the above analysis removing 2020 to see how your results change. Q3: If deciding in 2019 which of the two funds to invest in, which would you have chosen and why? II. Share class fees versus loads Like the example in class, the Morgan Stanley fund has several share classes, each with different fee structures. In the second part of your analysis, show how the Class A and Class C fees compare to the Vanguard fees when applied to a hypothetical portfolio that earns the S&P600 (small cap) index returns over a 35-year investment horizon (i.e., the minimum number of years you are likely to work before retiring). Begin by repeating the analysis from part I for the S&P600 index (i.e., using the same formulas, fill in the green cells below the index returns) . . Assume the following inputs (yellow cells) You will invest $19,500 per year (the max permissible for a 401k plan) in each year for the next 35 years. You will earn the average S&P600 return in each of the 35 years. Be careful: make sure you choose the right return - arithmetic or geometric. For management fees, from the fund information below, use the "Total Annual Fund Operating Expenses" before any fee waiver. For loads, also from the fund information below, include sales charges imposed at either the time fund shares are purchased (front end) or deferred until fund shares are sold (back- end). o Ignore redemption fees, which are imposed if shares are owned for less than 30 days. . Calculate the value of each fund in each year. To do this, calculate using formulas only, the value of your investment at the end of each year. For the first year, your formula should incorporate the return on $19,500 after fees. For the second year, your formula should sum the first-year value and the incremental investment ($19,500), and then calculate the value at the end of the year given the assumed returns and fees. Hint: when calculating the after-fee MS class A value, remember to deduct the percentage (front end) load from the $19,500 investment each year. Embed that deduction into your formula. . . Hint: when calculating the after-fee MS class C value, do it in two parts. In the third column, ignore the load. In the fourth column, simply deduct the load percentage in each year. Q4: (green cells) What is the value of each fund in year 35? What is the dollar difference in ending fund values between the Vanguard fees and MS fees? What is the percent difference? (box) Explain which MS share class is better and why. Morgan Stanley Institutional Fund, Inc. Inception Portfolio Class C (MSCOX) Average Annual Returns Return Expenses Nisk of Category Overall Rating ***** Rating intormation YTD Daily +6,89% 1 Y -79.39% 3Y +53.46% 5 Yrs 36.90% 10 yrs 21.11% Summary Performance & Risk Ratings Composition Fees & Distributions View All Tabs MORE > MORE Details Morningstar Cangry Small Growth Fundinception 11/1/199 4. Exp Rato Gros 227 4.39 Expo 2.15 Redemption Fee Time Yes Share Casino 531/2017 NAV $19.08 Der 1.00% PAS $1.942 39 MS.TRedemption Fee 2.00% Top 10 Holdings AS OF 32.90% of Total Portfolio MSUXX Morgan Stanley Trees RON Pet Cor OSTK Overstock.com PSLY Flyine APPH Appia Corp SFX Sench Farine Class A ATEX Aine DOCS Deimily reas Victor PL CRCT Cricut in Ordinay Shares-Class A 100 ildings of Monument $2.500.00 Tumor 132% 3.70% 3.45% 3.34% 2.79% 2.70 Share Classes $40.83 12 Mon Low $13.51 - $27.73 2.72% 2009 2.4 Inception Portfolio (Con't) periods and since inception compare with those of a broad measure of market performance, as well as an index that represents a group of similar mutual funds, over time. The performance of the other classes, which is shown in the table below, will differ because the classes have different ongoing fees. The Fund's returns in the table include the maximum applicable sales charge for Class A and Class C and assume you sold your shares at the end of each period (unless otherwise noted). The Fund's past performance, before and after taxes, is not necessarily an indication of how the Fund will perform in the future. Updated performance information is available online at www.morganstanley.com/im or by calling toll-free 1-800-548-7786. Annual Total Returns-Calendar Years 300 150 100% 12210 217 2711 0 09 9.50 0335 -100 2005 2011 '12 13 "14 "15 '16 "17 '18 Shareholder Fees (fees paid directly from your investment) Class Is None Classi Class A A Class L Class C C Maximum sales charge (load) imposed on purchases (as a percentage of offering price) None 5.25% None None Maximum deferred sales charge (load) (as a percentage based on the lesser of the offering price or NAV at redemption) None None None 1.00% Redemption Fee (as a percentage of the amount redeemed on redemptions made within 30 days of purchase) 2.00% 2.00% 2.00% 2.00% % Annual Fund Operating Expenses (expenses that you pay each year as a percentage of the value of your investment) None 2.00% Advisory Feed Distribution and/or Shareholder Service (12b-1) Fee /) Other Expenses Total Annual Fund Operating Expenses Fee Waiver and/or Expense Reimbursement Total Annual Fund Operating Expenses After Fee Waiver andlor Expense Reimbursement Class 1 0.92% None 0.27% 1.19% 0.19% Class A 0.92% 0.25% 0.28% 1.45% 0.10% Class 0.92% 0.75% 0.44% 2.11% 0.26% Class C 0.92% 1.00% 0.35% 2.27% 0.17% Class Is 0.92% None 0.20% 1.12% 0.19% 1.00% 1.35% 1.85% 2.10% 0.93% Vanguard Small-Cap Growth Index Fund Admiral Shares (VSGAX) Average Amatuma Returns Risk of this Category *** Rating on 3Y 10 Y YTD Daily .8.19% 1 36.84% 5 Yra +19.65% Summary Performance & Risk Ratings Composition Fees & Distributions View All Tabs MORE Purdin 5/21/1990 Fidelity Index Funds in the Morningstar Category AS OF 10/31/201 VSGAX Woming Cagay na Varga Small Cap Growth Index Fund Admiral Share FECGX Fidely Small Cap Growth in dosund Details Morning Ceny Small Growth Share Classroom 9/27/2011 Exp Rate 0.07 ER 0.07% NIV Thensioen 575 so 50 0010 0.074100 Thanation Fee Online $75.00 Tumowe Role 24% $101.48 Minimum $2.500.00 Porto Aanes (SM $38.664.40 7719 Expense Radio Net Gross YTDY AS OF 19 3 Yra Yra SY 10 Yrs 3.3 Shure Classe A $17.588.12 12 Month Low High $76.82 $106.18 15 Compare Seyinde 35.30 Annual Total Retums - Vanguard Small Cap Growth Index Fund Admiral Shares 2012 2013 2014 2015 2016 2017 2018 2019 2020 50% 40% % 38.22 32.76 30% 21.92 20% 17.66 10.73 10% 4.02 0% -10% 2.52 5.68 -20% During the periods shown in the bar chart, the highest and lowest returns for a calendar quarter were: Total Return Quarter Highest 32.92% June 30, 2020 Lowest -24.22% March 31, 2020 Sales Charge (Load) Imposed on Purchases Purchase Fee Sales Charge (Load) Imposed on Reinvested Dividends Redemption Fee Account Service Fee Per Year (for certain fund account balances below $10,000) None None None None $20 Annual Fund Operating Expenses (Expenses that you pay each year as a percentage of the value of your investment) ( Management Fees 12b- 1 Distribution Fee Other Expenses Total Annual Fund Operating Expenses 0.06% None 0.01% 0.07% Ten your allar la part Ingre 2000 pericum STB in d. Annual intrat Annual Farum SP Marpon Stanley Varare Varpur Tocal Expense Lood Vanguard Marpan Stanwy Class Al Morgan Series Class Morgan Stanley 201 2013 2011 2011 20 201 2013 2018 2013 2029 58200 small copinde 2013 2013 1.1954 20:1 20.97% 2014 4.11 20:5 2016 32 A2 2017 1501 2015 -2.53 20: L.IS 202 21 32% 20:3 20:1 2014 20:5 2016 2017 2018 2018 2020 Vinard MS Class MS Chan Charles A Return after 36 year Career ar El SEDAN anth Gent Arith Gel GEDANE Vale a SIG 3D Side Sides or Sharper ar Share Sharpe 1 Araw 25 20 92 Arne 25 GARAW 1 30 10 15 20 25 -Vanguard -- MS Class AMS Class 01 ASACI Laserto Vanguard Lassento angerd