

Answered step by step
Verified Expert Solution
Question
1 Approved Answer
Help with e and f Part 2: Dupont Analysis OROE Trend & Peer Comparison Analysis: 12/31/2020 12/31/2019 Bank PG1 Bank PG1 OROE% OROA% 1.00 1.47
Help with e and f
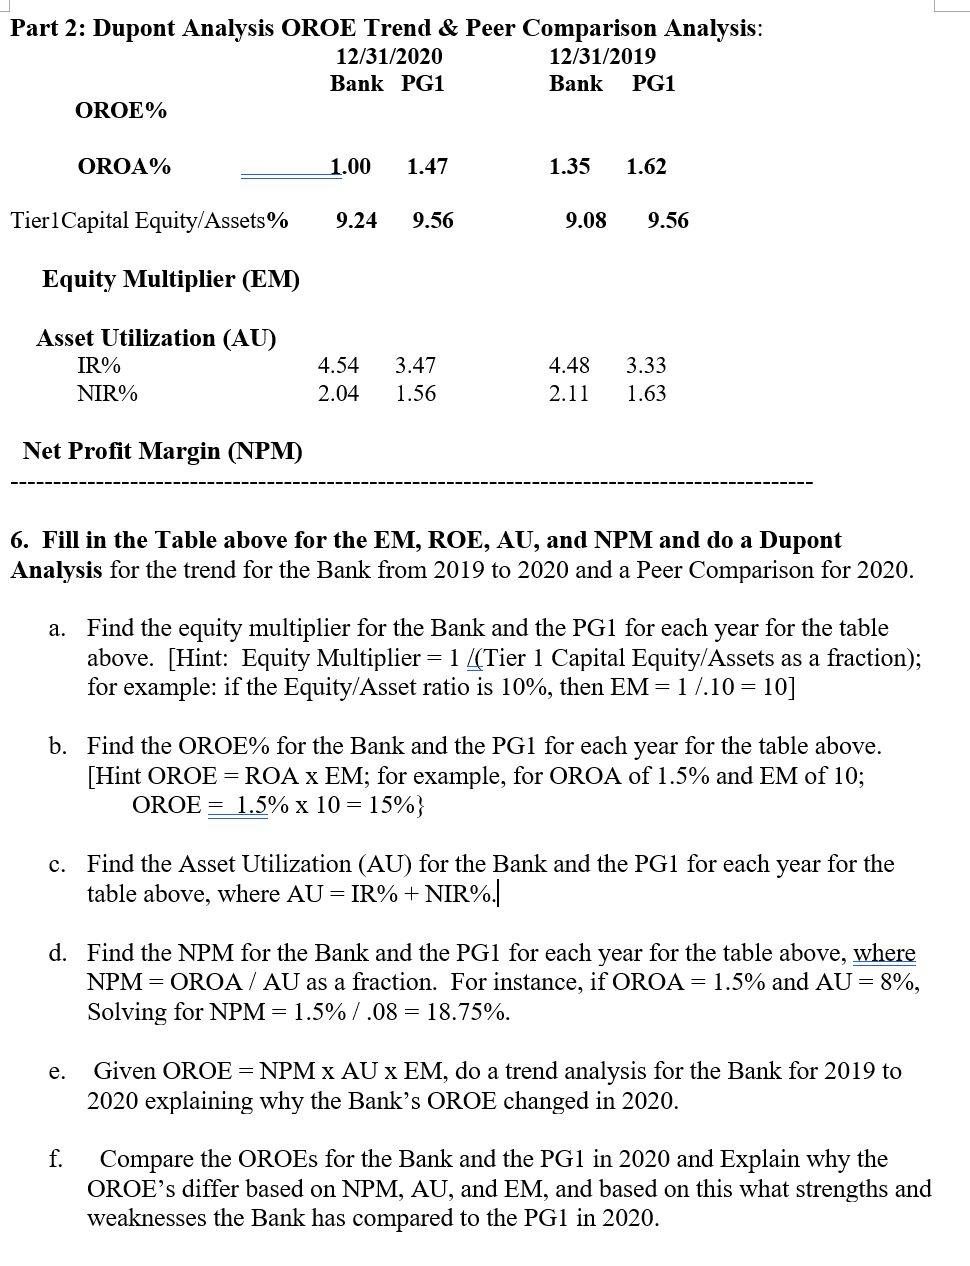
Part 2: Dupont Analysis OROE Trend & Peer Comparison Analysis: 12/31/2020 12/31/2019 Bank PG1 Bank PG1 OROE% OROA% 1.00 1.47 1.35 1.62 Tier1Capital Equity/Assets% 9.24 9.56 9.08 9.56 Equity Multiplier (EM) Asset Utilization (AU) IR% NIR% 4.54 2.04 3.47 1.56 4.48 2.11 3.33 1.63 Net Profit Margin (NPM) 6. Fill in the Table above for the EM, ROE, AU, and NPM and do a Dupont Analysis for the trend for the Bank from 2019 to 2020 and a Peer Comparison for 2020. a. Find the equity multiplier for the Bank and the PG1 for each year for the table above. [Hint: Equity Multiplier = 1 {{Tier 1 Capital Equity/Assets as a fraction); for example: if the Equity/Asset ratio is 10%, then EM=1/.10 = 10] b. Find the OROE% for the Bank and the PG1 for each year for the table above. [Hint OROE = ROA X EM; for example, for OROA of 1.5% and EM of 10; OROE = 1.5% x 10 = 15%} c. Find the Asset Utilization (AU) for the Bank and the PG1 for each year for the table above, where AU = IR% + NIR%. d. Find the NPM for the Bank and the PG1 for each year for the table above, where NPM = OROA / AU as a fraction. For instance, if OROA= 1.5% and AU = 8%, Solving for NPM = 1.5%/.08 = 18.75%. e. Given OROE = NPM X AU X EM, do a trend analysis for the Bank for 2019 to 2020 explaining why the Bank's OROE changed in 2020. f. Compare the OROEs for the Bank and the PG1 in 2020 and Explain why the OROE's differ based on NPM, AU, and EM, and based on this what strengths and weaknesses the Bank has compared to the PG1 in 2020. Part 2: Dupont Analysis OROE Trend & Peer Comparison Analysis: 12/31/2020 12/31/2019 Bank PG1 Bank PG1 OROE% OROA% 1.00 1.47 1.35 1.62 Tier1Capital Equity/Assets% 9.24 9.56 9.08 9.56 Equity Multiplier (EM) Asset Utilization (AU) IR% NIR% 4.54 2.04 3.47 1.56 4.48 2.11 3.33 1.63 Net Profit Margin (NPM) 6. Fill in the Table above for the EM, ROE, AU, and NPM and do a Dupont Analysis for the trend for the Bank from 2019 to 2020 and a Peer Comparison for 2020. a. Find the equity multiplier for the Bank and the PG1 for each year for the table above. [Hint: Equity Multiplier = 1 {{Tier 1 Capital Equity/Assets as a fraction); for example: if the Equity/Asset ratio is 10%, then EM=1/.10 = 10] b. Find the OROE% for the Bank and the PG1 for each year for the table above. [Hint OROE = ROA X EM; for example, for OROA of 1.5% and EM of 10; OROE = 1.5% x 10 = 15%} c. Find the Asset Utilization (AU) for the Bank and the PG1 for each year for the table above, where AU = IR% + NIR%. d. Find the NPM for the Bank and the PG1 for each year for the table above, where NPM = OROA / AU as a fraction. For instance, if OROA= 1.5% and AU = 8%, Solving for NPM = 1.5%/.08 = 18.75%. e. Given OROE = NPM X AU X EM, do a trend analysis for the Bank for 2019 to 2020 explaining why the Bank's OROE changed in 2020. f. Compare the OROEs for the Bank and the PG1 in 2020 and Explain why the OROE's differ based on NPM, AU, and EM, and based on this what strengths and weaknesses the Bank has compared to the PG1 in 2020Step by Step Solution
There are 3 Steps involved in it
Step: 1

Get Instant Access to Expert-Tailored Solutions
See step-by-step solutions with expert insights and AI powered tools for academic success
Step: 2

Step: 3
Ace Your Homework with AI
Get the answers you need in no time with our AI-driven, step-by-step assistance
Get Started
Weathering The Storm A Quick Guide To Safeguarding Your Finances During Economic Recession
Authors: Liam Wilhelm
1st Edition
979-8864393628