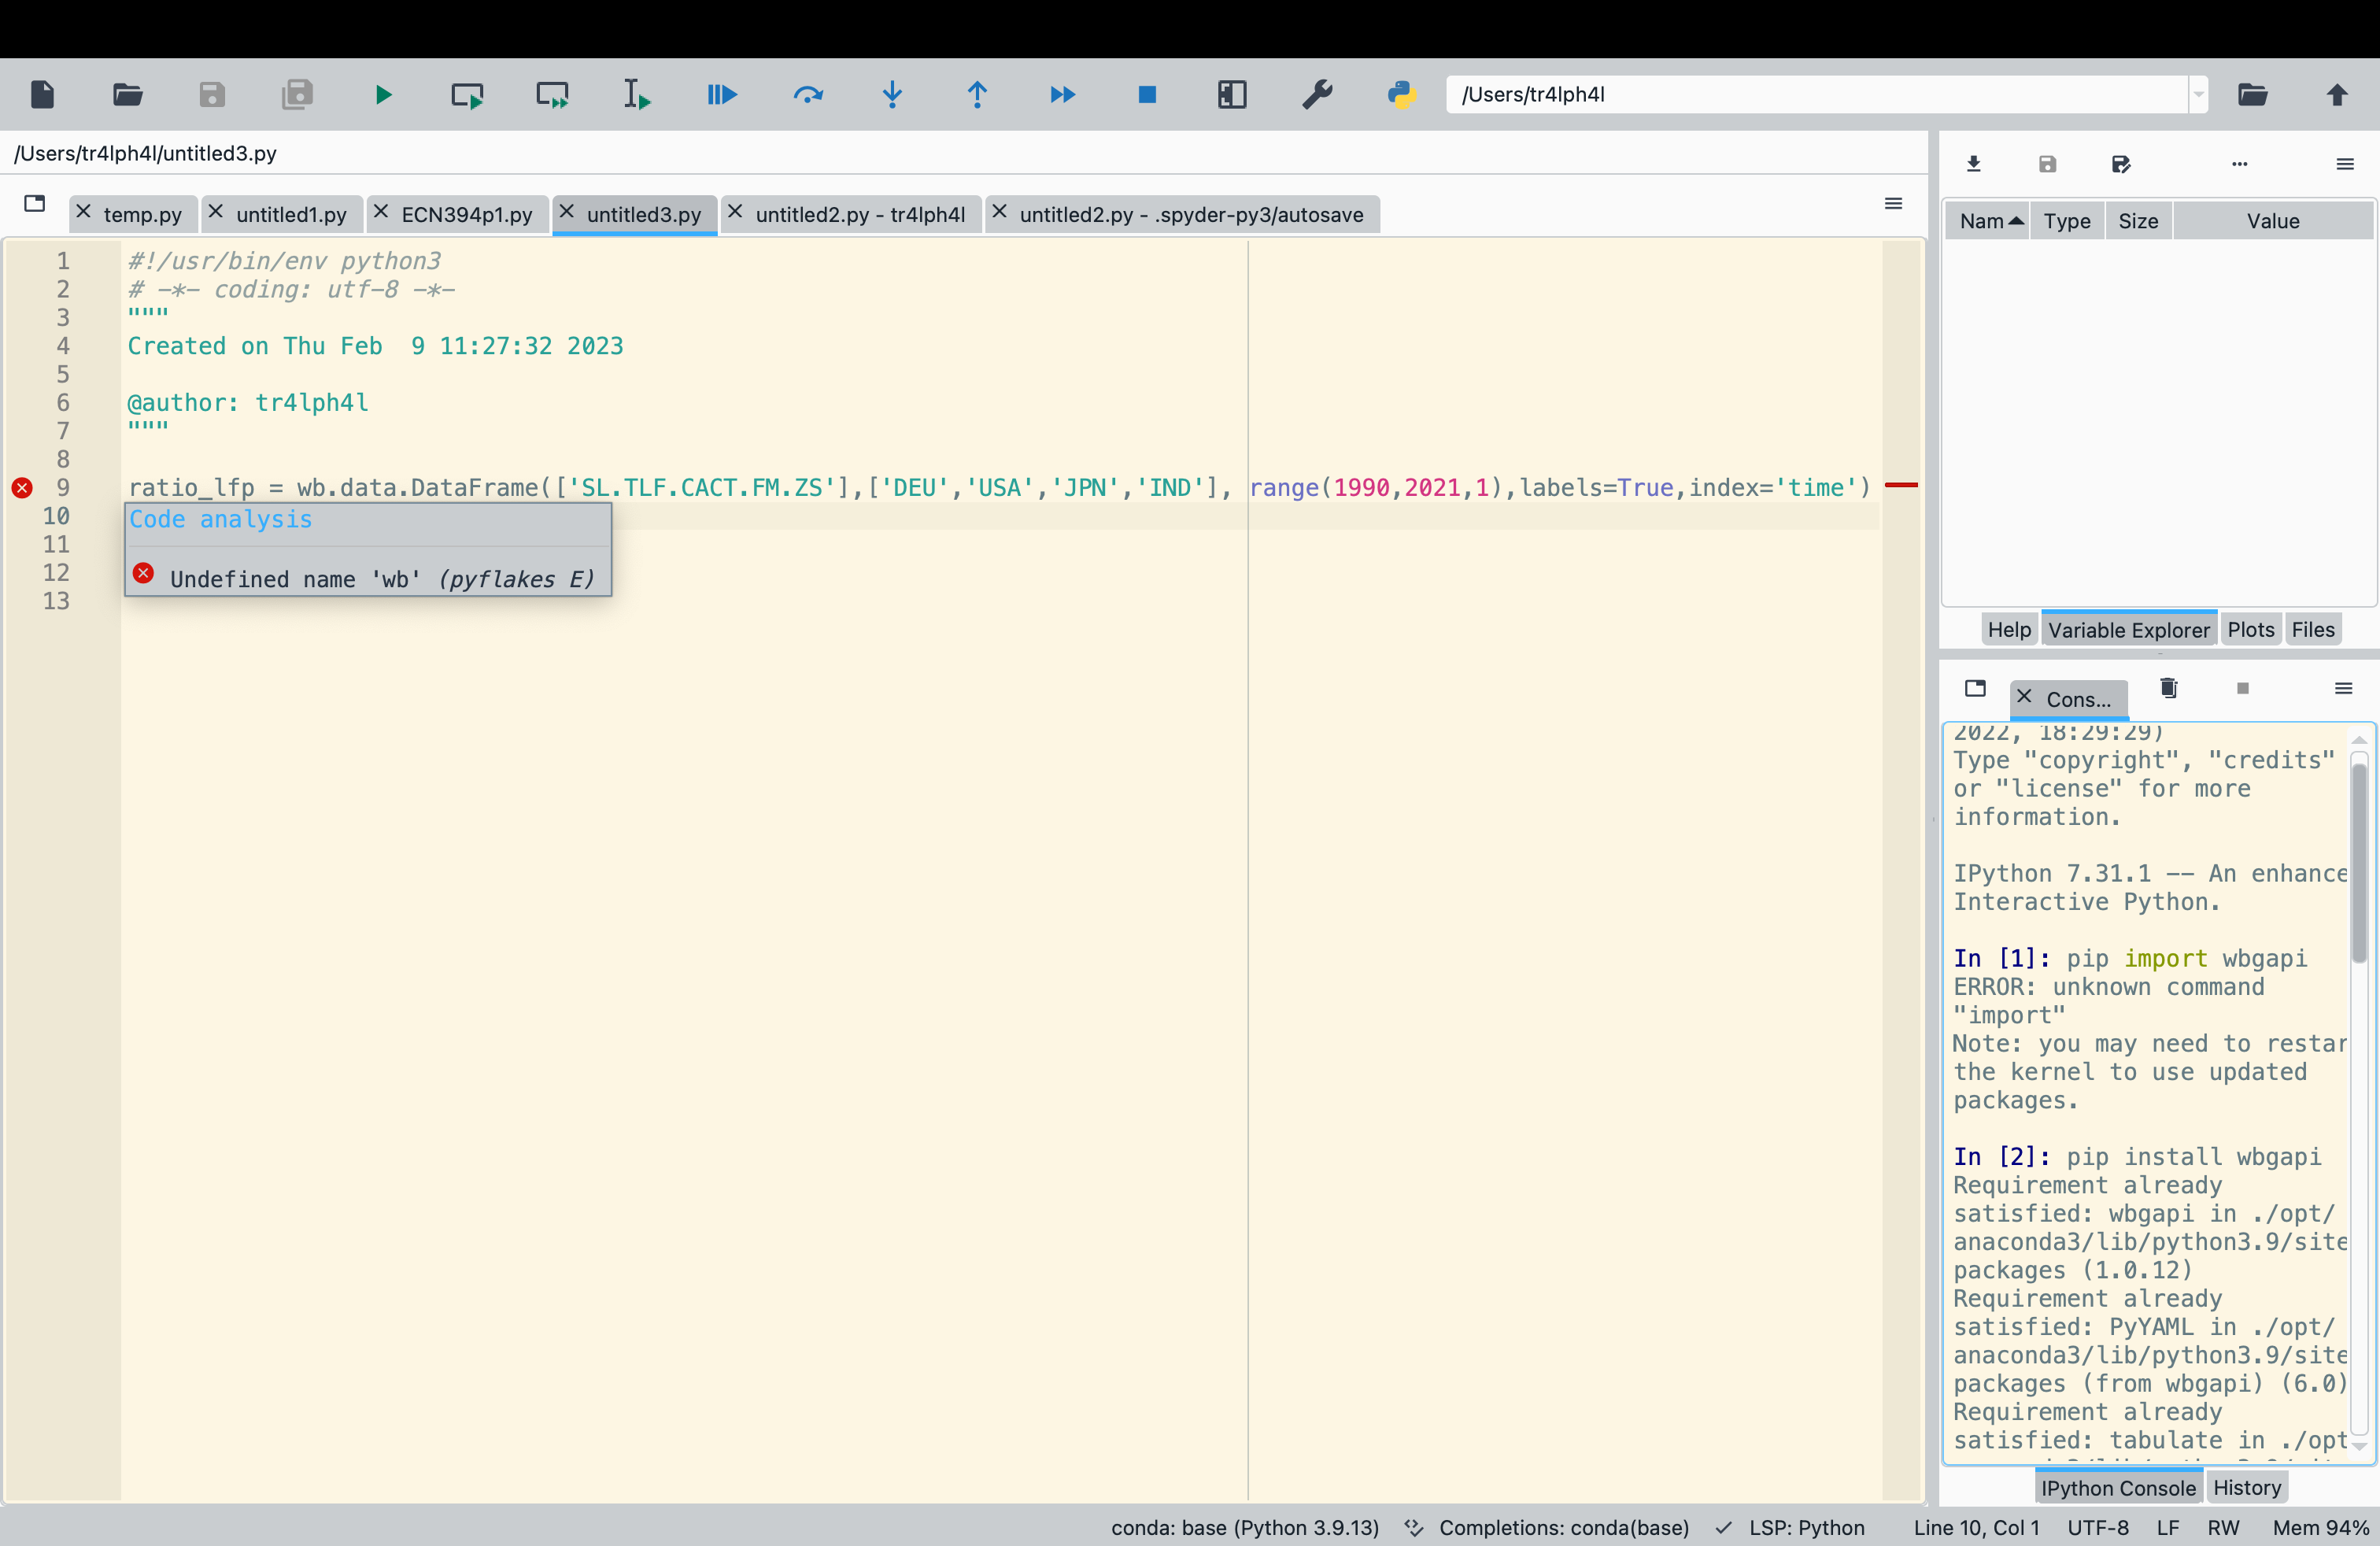
 I am having issues with this. My professor is doing a small class within our class on python but I have no clue what I am doing. I am getting an error for this, and I am unsure as to why. I am using spyder 5.3.3. I installed pip using conda. From there I installed and imported pandas, matplotlib.pyplot, and wbgapi (which is the data that we are using from the World Bank). I imported matplotlib.pyplot as plt, pandas as pd, and wbgapi as wb.
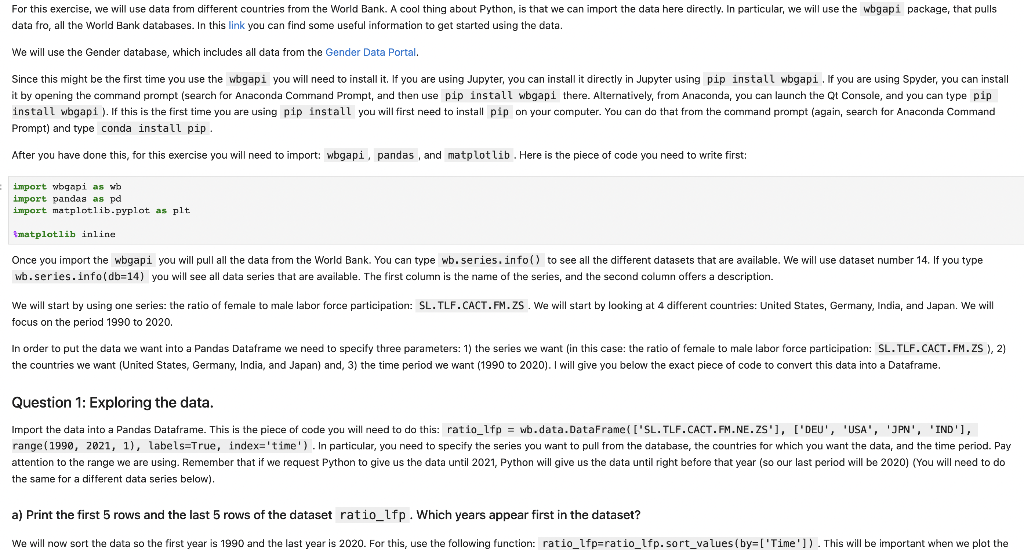
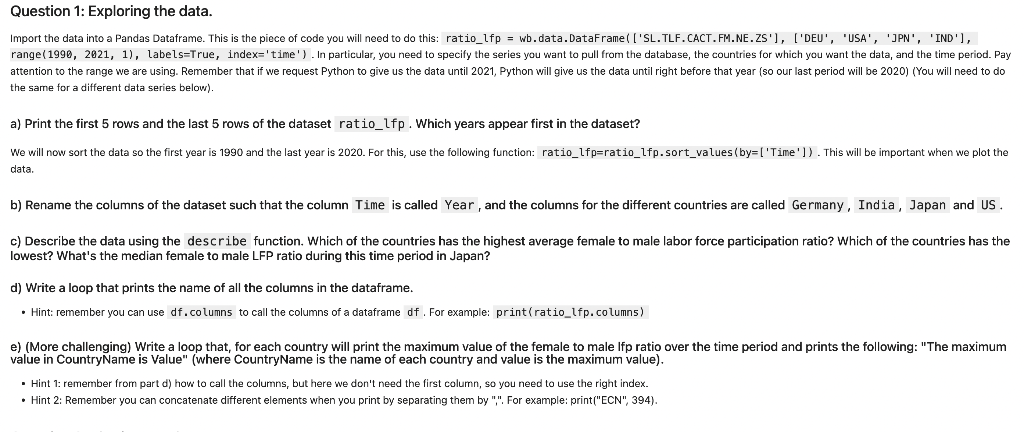
data fro, all the World Bank databases. In this link you can find some useful information to get started using the data. We will use the Gender database, which includes all data from the Gender Data Portal. Prompt) and type conda install pip. After you have done this, for this exercise you will need to import: wbgapi, pandas, and matplotlib . Here is the piece of code you need to write first: import wbgapi as wb import pandas as pd import matplot.lib.pyplot as plt imatplotlib inline wb. series. info (db=14) you will see all data series that are available. The first column is the name of the series, and the second column offers a description. focus on the period 1990 to 2020 . Question 1: Exploring the data. the same for a different data series below). a) Print the first 5 rows and the last 5 rows of the dataset ratio_lfp. Which years appear first in the dataset? Import the data into a Pandas Dataframe. This is the piece of code you will need to do this: ratio_lfp = wb.data.DataFrame([ 'SL.TLF.CACT. FM.NE.ZS'], ['DEU', 'USA', 'JPN ', 'IND'], range(1990, 2021, 1), labels=True, index=' time' ). In particular, you need to specify the series you want to pull from the database, the countries for which you want the data, and the time period. Pay attention to the range we are using. Remember that if we request Python to give us the data until 2021, Python will give us the data until right before that year (so our last period will be 2020) (You will need to do the same for a different data series below). a) Print the first 5 rows and the last 5 rows of the dataset ratio_lfp. Which years appear first in the dataset? We will now sort the data so the first year is 1990 and the last year is 2020. For this, use the following function: ratio_lfp=ratio_lfp.sort_values (by=[ 'Time ']) . This will be important when we plot the data. b) Rename the columns of the dataset such that the column Time is called Year, and the columns for the different countries are called Germany, India, Japan and US . c) Describe the data using the describe function. Which of the countries has the highest average female to male labor force participation ratio? Which of the countries has the lowest? What's the median female to male LFP ratio during this time period in Japan? d) Write a loop that prints the name of all the columns in the dataframe. - Hint: remember you can use df. columns to call the columns of a dataframe df . For example: print (ratio_lfp. columns) e) (More challenging) Write a loop that, for each country will print the maximum value of the female to male lfp ratio over the time period and prints the following: "The maximum value in CountryName is value" (where CountryName is the name of each country and value is the maximum value). - Hint 1: remember from part d) how to call the columns, but here we don't need the first column, so you need to use the right index. - Hint 2: Remember you can concatenate different elements when you print by separating them by ",". For example: print("ECN", 394). /Users/tr4lph4I/untitled3.py