Question
I am having trouble figuring out how to calculate a ratio using a data model (power pivot) in Excel. Below is the homework question I
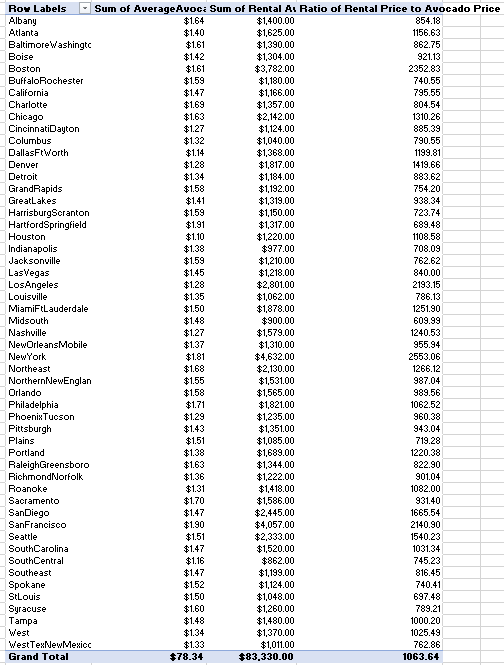
I am having trouble figuring out how to calculate a ratio using a data model (power pivot) in Excel. Below is the homework question I am struggling with. The screenshot shows the pivot table I have created so far using data from my power pivot data model. I just can't figure out how to calculate a ratio (has to be calculated within the data model), all my formulas error out. And then need to create a KPI from that ratio.
Question: Create a Pivot Table on a new sheet to the right of Profitability called Rental and Ratio. The pivot table should show the name of every region and a KPI that you calculate. Create a KPI that considers the price of avocados in a region and the price of rental housing in that region. Ensure that some of the regions score high (a green light) and that others do not (yellow and red). Below the pivot table, explain what your KPI is, how it is calculated, and what exactly it means to someone looking at your table.

Step by Step Solution
There are 3 Steps involved in it
Step: 1

Get Instant Access to Expert-Tailored Solutions
See step-by-step solutions with expert insights and AI powered tools for academic success
Step: 2

Step: 3

Ace Your Homework with AI
Get the answers you need in no time with our AI-driven, step-by-step assistance
Get Started


