

Answered step by step
Verified Expert Solution
Question
1 Approved Answer
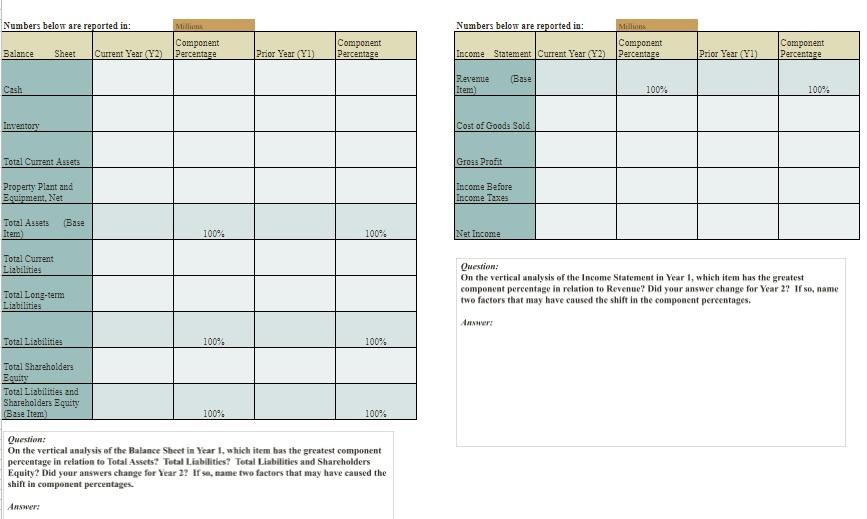
I need assistance with the Vertical Analysis Ratio chart below for Ford Motor Co. for year 2018? Please assist if possible Numbers below are reported
I need assistance with the Vertical Analysis Ratio chart below for Ford Motor Co. for year 2018? Please assist if possible
Step by Step Solution
There are 3 Steps involved in it
Step: 1

Get Instant Access to Expert-Tailored Solutions
See step-by-step solutions with expert insights and AI powered tools for academic success
Step: 2

Step: 3
Ace Your Homework with AI
Get the answers you need in no time with our AI-driven, step-by-step assistance
Get Started
Horngren S Financial And Managerial Accounting The Managerial Chapters RENTAL EDITION
Authors: Miller-Nobles
1st Edition
0136503748, 978-0136503743