In this assignment, you will be using inferential statistics to determine if a claim about college tuition cost is accurate. According to the College
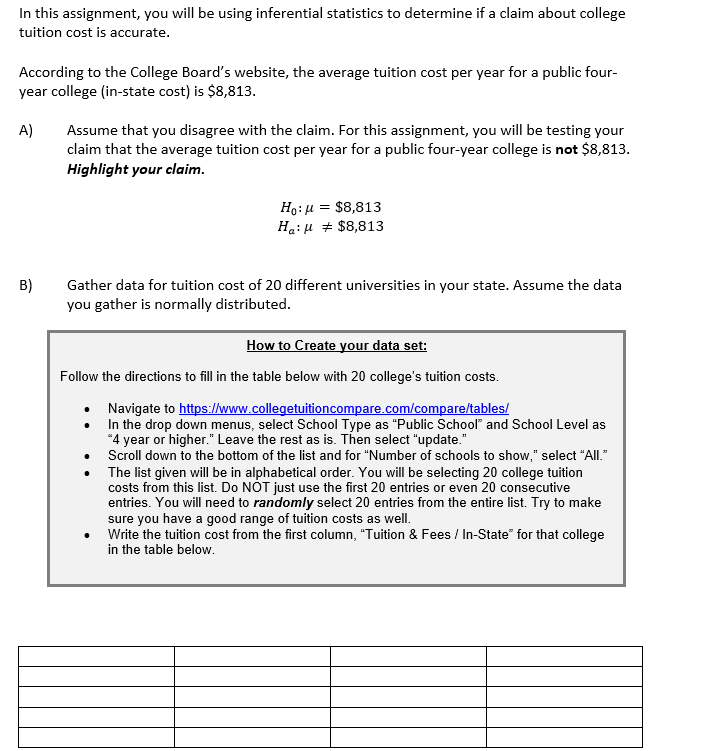
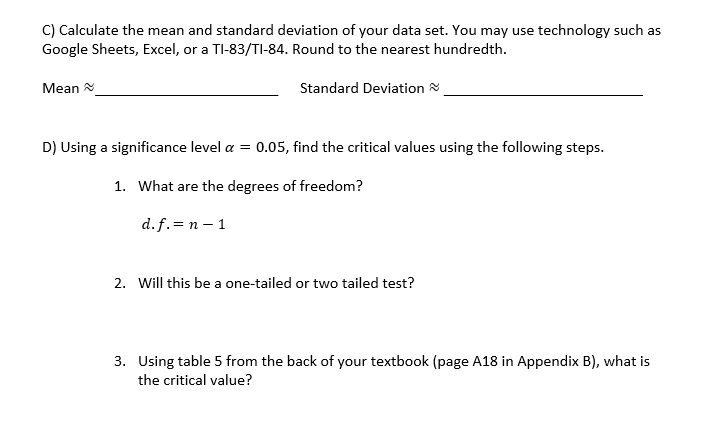
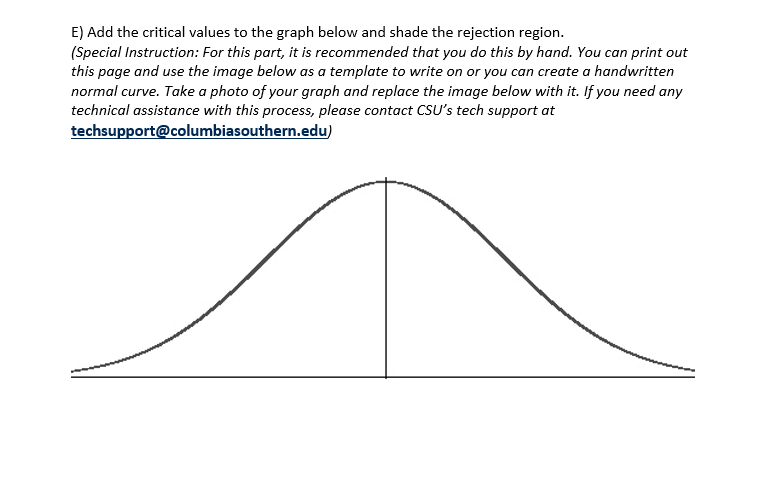
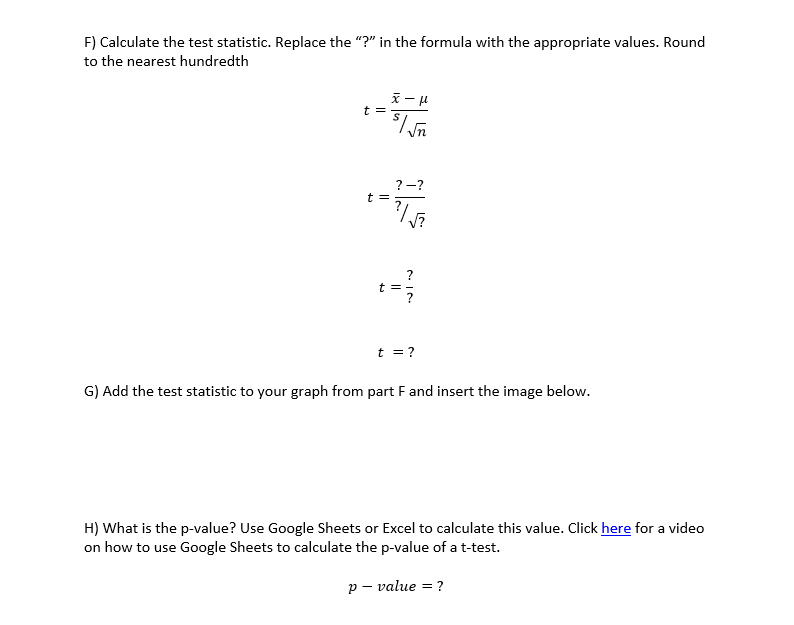
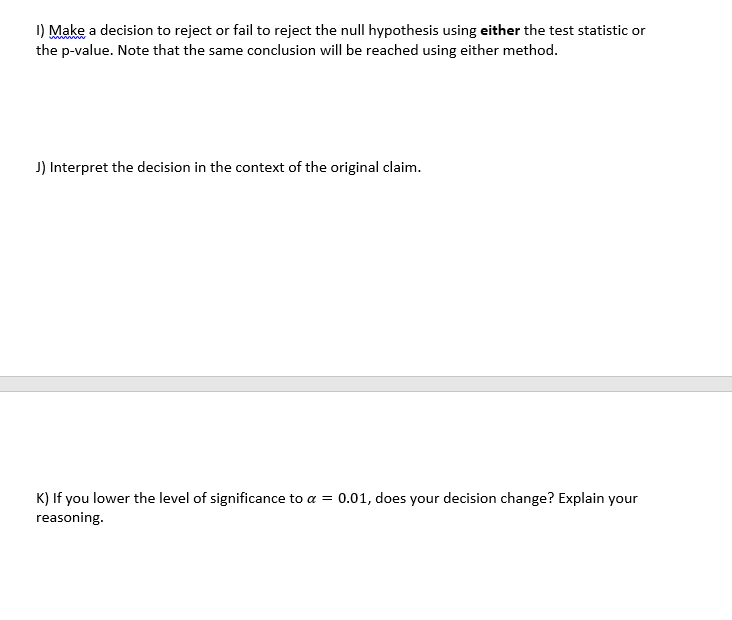
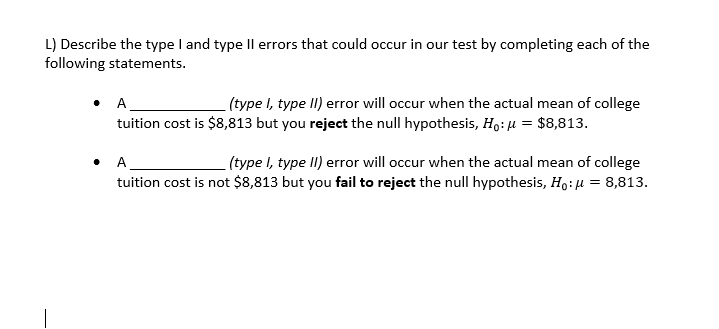
In this assignment, you will be using inferential statistics to determine if a claim about college tuition cost is accurate. According to the College Board's website, the average tuition cost per year for a public four- year college (in-state cost) is $8,813. A) Assume that you disagree with the claim. For this assignment, you will be testing your claim that the average tuition cost per year for a public four-year college is not $8,813. Highlight your claim. B) Ho: = $8,813 Ha $8,813 Gather data for tuition cost of 20 different universities in your state. Assume the data you gather is normally distributed. How to Create your data set: Follow the directions to fill in the table below with 20 college's tuition costs. Navigate to https://www.collegetuitioncompare.com/compare/tables/ In the drop down menus, select School Type as "Public School" and School Level as "4 year or higher." Leave the rest as is. Then select "update." Scroll down to the bottom of the list and for "Number of schools to show," select "All." The list given will be in alphabetical order. You will be selecting 20 college tuition costs from this list. Do NOT just use the first 20 entries or even 20 consecutive entries. You will need to randomly select 20 entries from the entire list. Try to make sure you have a good range of tuition costs as well. Write the tuition cost from the first column, "Tuition & Fees / In-State" for that college in the table below. C) Calculate the mean and standard deviation of your data set. You may use technology such as Google Sheets, Excel, or a TI-83/TI-84. Round to the nearest hundredth. Mean Standard Deviation D) Using a significance level = 0.05, find the critical values using the following steps. 1. What are the degrees of freedom? d.f.=n-1 2. Will this be a one-tailed or two tailed test? 3. Using table 5 from the back of your textbook (page A18 in Appendix B), what is the critical value? E) Add the critical values to the graph below and shade the rejection region. (Special Instruction: For this part, it is recommended that you do this by hand. You can print out this page and use the image below as a template to write on or you can create a handwritten normal curve. Take a photo of your graph and replace the image below with it. If you need any technical assistance with this process, please contact CSU's tech support at techsupport@columbiasouthern.edu) F) Calculate the test statistic. Replace the "?" in the formula with the appropriate values. Round to the nearest hundredth t = x-pl n ?-? ? 212 + t = ? G) Add the test statistic to your graph from part F and insert the image below. H) What is the p-value? Use Google Sheets or Excel to calculate this value. Click here for a video on how to use Google Sheets to calculate the p-value of a t-test. p-value = ? I) Make a decision to reject or fail to reject the null hypothesis using either the test statistic or the p-value. Note that the same conclusion will be reached using either method. J) Interpret the decision in the context of the original claim. K) If you lower the level of significance to a = 0.01, does your decision change? Explain your reasoning. L) Describe the type I and type II errors that could occur in our test by completing each of the following statements. A (type I, type II) error will occur when the actual mean of college tuition cost is $8,813 but you reject the null hypothesis, Ho: = $8,813. A (type I, type II) error will occur when the actual mean of college tuition cost is not $8,813 but you fail to reject the null hypothesis, Ho: = 8,813.
Step by Step Solution
There are 3 Steps involved in it
Step: 1

See step-by-step solutions with expert insights and AI powered tools for academic success
Step: 2

Step: 3

Ace Your Homework with AI
Get the answers you need in no time with our AI-driven, step-by-step assistance
Get Started


