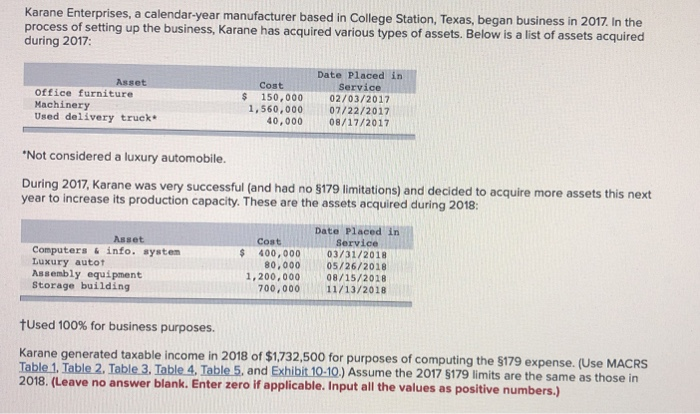
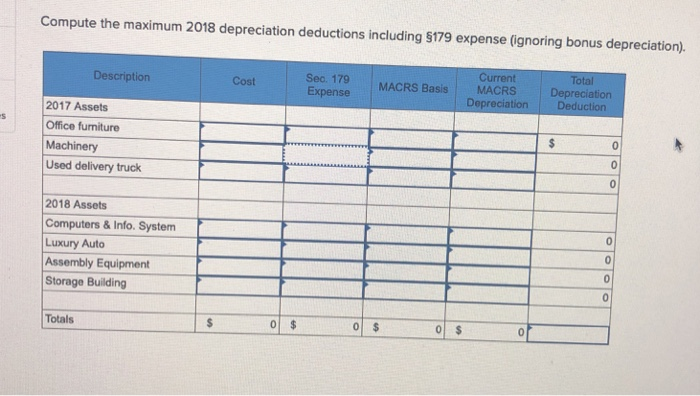
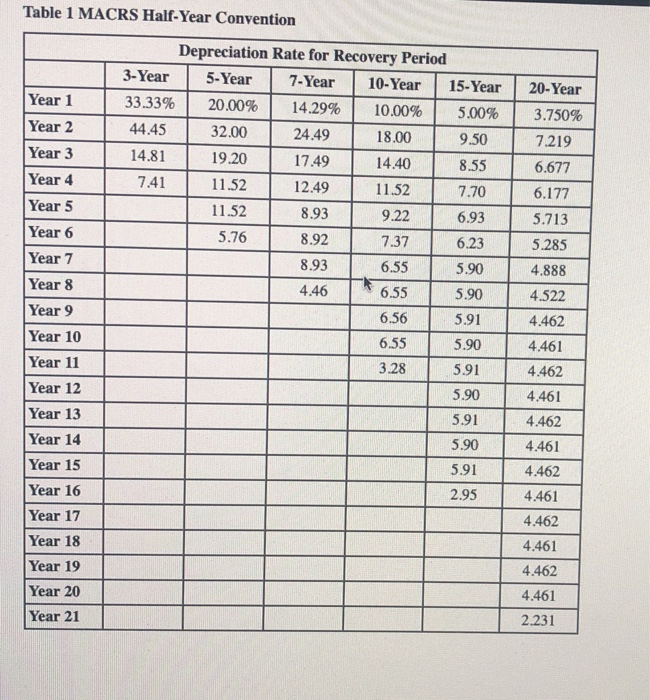
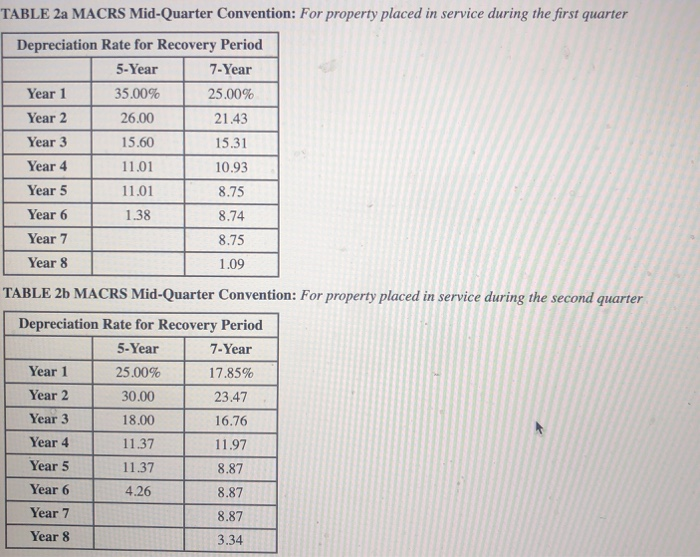
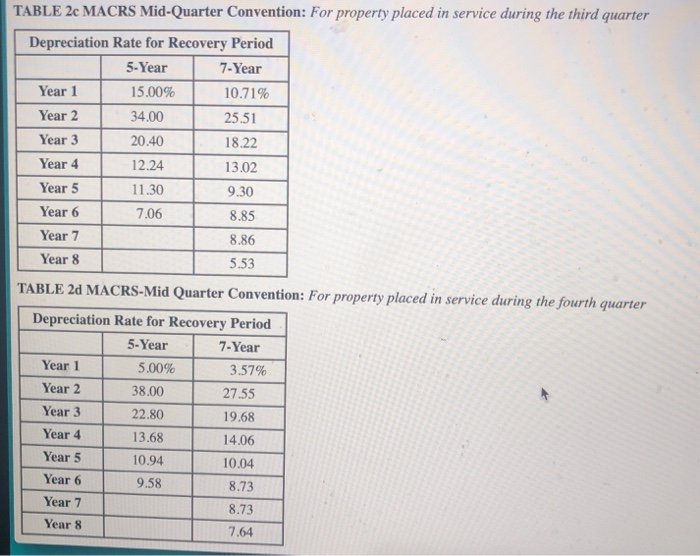
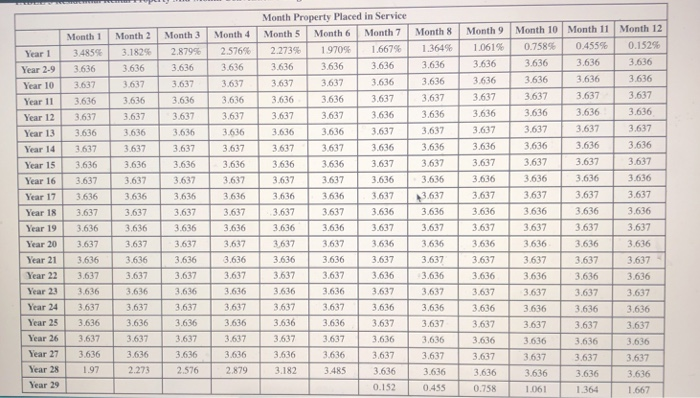
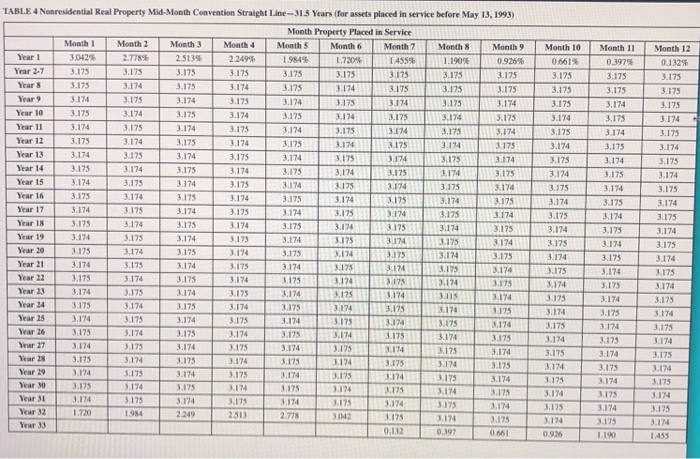
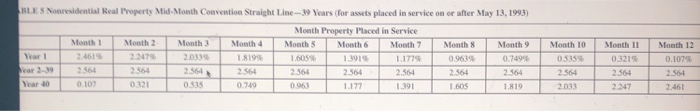
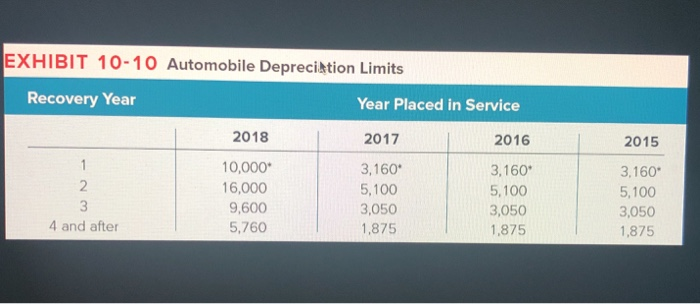
Karane Enterprises, a calendar-year manufacturer based in College Station, Texas, began business in 2017. In the process of set tting up the business, Karane has acquired various types of assets. Below is a list of assets acquired during 2017: Date Placed in Service Asset Cost 150,000 office furniture Machinery Used delivery truck 02/03/2017 1,560,000 07/22/2017 40,000 08/17/2017 Not considered a luxury automobile. During 2017, Karane was very successful (and had no $179 limitations) and decided to acquire more assets this next year to increase its production capacity. These are the assets acquired during 2018: Date Placed in Service Asset Cost Computers&info. system Luxury autot Assembly equipment Storage building 400,00003/31/2018 80,00005/26/2018 1,200,000 08/15/2018 700,00011/13/2018 tused 100% for business purposes. xable income in 2018 of $1732,500 for purposes of computing the $179 expense. (Use MACRS Table 1. Table 2. Table 3. Table 4. Table 5, and Exhibit 10-10.) Assume the 2017 5179 limits are the same as those i 2018. (Leave no answer blank. Enter zero if applicable. Input all the values as positive numbers.) Compute the maximum 2018 depreciation deductions including 179 expense (ignoring bonus depreciation). Total Seo. 179 Expense MACRS Depreciation Depreciation Deduc Description Cost MACRS Basis ion 2017 Assets Office furniture Machinery Used delivery truck 0 2018 Assets Computers & Info. System Luxury Auto Assembly Equipment Storage Building 0 Totals Table 1 MACRS Half-Year Convention Depreciation Rate for Recovery Period 3-Year 5Y 7-Year 10-Year 5-Yer 20-Year 33.33%| 20.00% | 14.29% | 10.00% | 5.00% | 3.750% 44.45 14.81 Year 1 Year 2 Year 3 Year 4 Year 5 Year 6 Year 7 Year 8 Year 9 Year 10 Year 11 Year 12 Year 13 Year 14 Year 15 Year Year 17 Year 18 Year 19 Year 20 32.00 19.20 11.52 11.52 5.76 18.00 14.40 11.52 9.22 7.37 6.55 9.50 8.55 7.70 6.93 7.219 24.49 17.49 12.49 8.93 8.92 8.93 4.46 6.677 7.41 5.713 5.285 4.888 6.55 5.904.522 4.462 4.461 4.462 4461 4.462 4.461 4.462 4.461 4.462 4.461 4.462 4.461 2.231 5.91 5.90 5.91 6.56 3.28 5.91 2.95 Year 21 TABLE 2a MACRS Mid-Quarter Convention: For property placed in service during the first quarter Depreciation Rate for Recovery Period 5-Year 35.00% 26.00 15.60 11.01 11.01 1.38 7-Year 25.00% 21.43 15.31 10.93 8.75 8.74 8.75 1.09 Year 1 Year 2 Year 3 Year 4 Year 5 Year 6 Year 7 Year 8 TABLE 2b MACRS Mid-Quarter Convention: For property placed in service during the second quarter Depreciation Rate for Recovery Period 5-Year 25.00% 30.00 18.00 11.37 11.37 4.26 7-Year 17.85% 23.47 16.76 11.97 8.87 8.87 8.87 3.34 Year 1 Year 2 Year 3 Year 4 Year 5 Year 6 Year 7 Year 8 TABLE 2c MACRS Mid-Quarter Convention: For property placed in service during the third quarter Depreciation Rate for Recovery Period 5-Year 15.00% 4.00 20.40 12.24 11.30 7.06 7-Year 10.71% 25.51 18.22 13.02 9.30 8.85 8.86 5.53 Year 1 Year 2 Year 3 Year 4 Year 5 Year 6 Year 7 Year 8 TABLE 2d MACRS-Mid Quarter Convention: For property placed in service during the fourth quarter Depreciation Rate for Recovery Period 5-Year 7-Year 3.57% 27.55 19.68 14.06 10.04 8.73 8.73 7.64 Year 1 Year 2 Year 3 Year 4 Year 5 Year 6 Year 7 Year 8 5 .00% 38.00 22.80 13.68 10.94 9.58 Month Property Placed in Service Month 6Month 7 Month 8 Month 9 Month 10 Month 11 Month 12 1970% 1.667% 1.354% 1.061% 0758% 0455%| 0352% Month 5 Month 4 Month 3 Month1Month 2 Year l | 3485% | 3.182%| 2.879%| 2.576%| 2.273% Year 2-93.636 Year 103637 Year 113636 Year 12 3.637 3.637 Year 13 3.636 Year 14 3.637 Year 15 3.636 Year 16 3.637 Year 17 3636 Year 183637 3.637 3.637 3637 Year 19 3.636 Year 203.637 3.636 3,636 3.636 3.637 3.636 3.637 3.636 3.637 3.637 3.637 3.637 3.636 3.637 3,637 3.637 3.636 3.636 3.637 3.637 3.637 3.637 3.636 3.636 3.637 3.636 3.637 3.636 3.637 3.636 3.637 3.637 3.637 3.636 3.636 3.637 3.636 3.637 3.637 3637 3.637 3636 3.637 3637 3.636 3.636 3.637 3.636 3.637 3.636 3.636 3.637 3.636 3.637 3.636 3.637 3.637 3.637 3.636 3.637 3.637 3.637 3.637 3.636 3.637 3,637 3.636 3.637 3.636 3.637 3.637 3.637 3.637 3.637 Year 233.636 Year 243.637 Year 25 3.636 Year 26 3.637 Year 27 3.636 Year 28 1.97 3.637 3.636 3.637 3.637 3.636 3.637 3.637 3.637 3.636 3.636 3.636 3.637 3.637 3.637 3.637 3 637 3.636 3.182 3.637 3,636 3.636 3.636 3.637 3.637 3.637 2.27 3.485 3.636 0.455 1.061 TABLE 4 Nonresidential Real Property Mid-Month Convention Straight Line-31 5 Years (for assets placed in service before May 13, 1993) Month Property Placed in Service Month Month oth 3 MonthMonth 5 Month6Month 7MnMonth9Month 10 Month I1 Month 12 3042% Year 1 Year 2-7 Year 8 2.513% 2.249% 3.175 1 .720% 3.175 1.190% 3.175 3.175 3.175 i 455% 0661% 0.397% 3.175 .175 3.174 3.175 3.174 3.175 3.174 .175 3.175 3.175 3.175 3.174 3.175 3.174 3.175 3.174 3.175 3.174 3.175 3.174 3.174 3.175 3.174 3.174 3.175 3.174 3.175 3174 Year 10 Year 11 Year 12 3.174 3.175 3.174 3.175 3.174 3.175 3.174 3.174 3.175 3.174 3.175 174 3.175 Year 14 3.174 3.175 3,174 3.175 3.174 3.175 31743.175 3.175 3.175 .174 Year 16 Year 17 Year 18 Year 19 Year 20 Year 21 3.175 3.174 3.174 3.174 3.174 .174 .175 3.174 .174 3.174 3.174 .173 3174 3.174 .174 .175 3.174 .175 .174 17 3.174 175 3.1741753074 3.174 3,174 3.175 3.174 Year 23 Year 24 Year 25 Year 26 Year 27 3.174 .174 3.175 3.175 3.174 3.175 3.174 3.175 3.174 3.174 3.174 3.174 175 3.175 3.174 3.175 Year 29 3.174 175 175 175 174 2513 Year 33 0 661 190 BLE S Nonresidential Real Property Mid-Month Convention Straight Line-39 Years (for assets placed in service on er after May 13,1993) Month Property Placed in Service Month I Month 2Month3Month 4 MonthMonth 6Month 7 Month Month 9 Month 10 Month 11Month 12 Year 1 ear 2-39 ear 40 2.461% 2564 256 0.107 2.247% 2033% 1.391% 2564 1.177% 2.564 1.819% 1.605% 2.564 0.963 0.963% 2564 1.605 0.749% 2.564 0535% 2564 0.321% 2.564 0.107% 2564 2.564 2.564 0.321 EXHIBIT 10-10 Automobile Depreciation Limits Recovery Year Year Placed in Service 2018 2017 2016 2015 10,000 16,000 9,600 5,760 3,160 5,100 3,050 1,875 3,160 5,100 3,050 1,875 3.160 5,100 3,050 1,875 2 4 and after